For cross-border sellers running Sponsored Products on Amazon US, deciding whether advertising should get more budget, lower bids or be shut down is not a matter of how high ACoS looks in absolute terms, but of comparing it with your own break-even ACoS: break-even ACoS equals your pre-ad profit margin, that is (selling price - purchase cost - platform commission and fulfilment fees) ÷ selling price. Below that line, each order still makes money on advertising alone, so you can keep spending and even add budget; above it, each order loses money on advertising alone, so lower bids or cut the loss-making keywords first. The only exception is the launch push for a new product: if advertising is levering organic ranking and the total advertising cost ratio at store level (TACoS) keeps falling, ACoS may be allowed to sit above break-even for a while, but an explicit stop condition must be set at the same time.
1. The decision: when ACoS looks high, add budget, lower bids or shut down?
For a cross-border seller running Sponsored Products on Amazon US, when an ad group's or keyword's ACoS comes in above expectation, the question of whether to add budget, lower bids or shut down is not about how high ACoS looks in absolute terms, but about comparing it with the seller's own break-even ACoS.
That decision arises at two different stages of a product's life, with opposite conclusions: for a mature product that already works and has stable margins, keep advertising as long as ACoS is below break-even and cut it once it goes above; for a new product still climbing the rankings, ACoS may be allowed above break-even for a period in order to lever organic traffic, but it must be backed by a store-level metric that is falling (TACoS) and an explicit stop condition. This article uses Amazon's official definitions of ACoS and ROAS to turn that rule into numbers you can recalculate.
2. Mechanism: how ACoS, ROAS and break-even ACoS decide whether each order makes or loses money
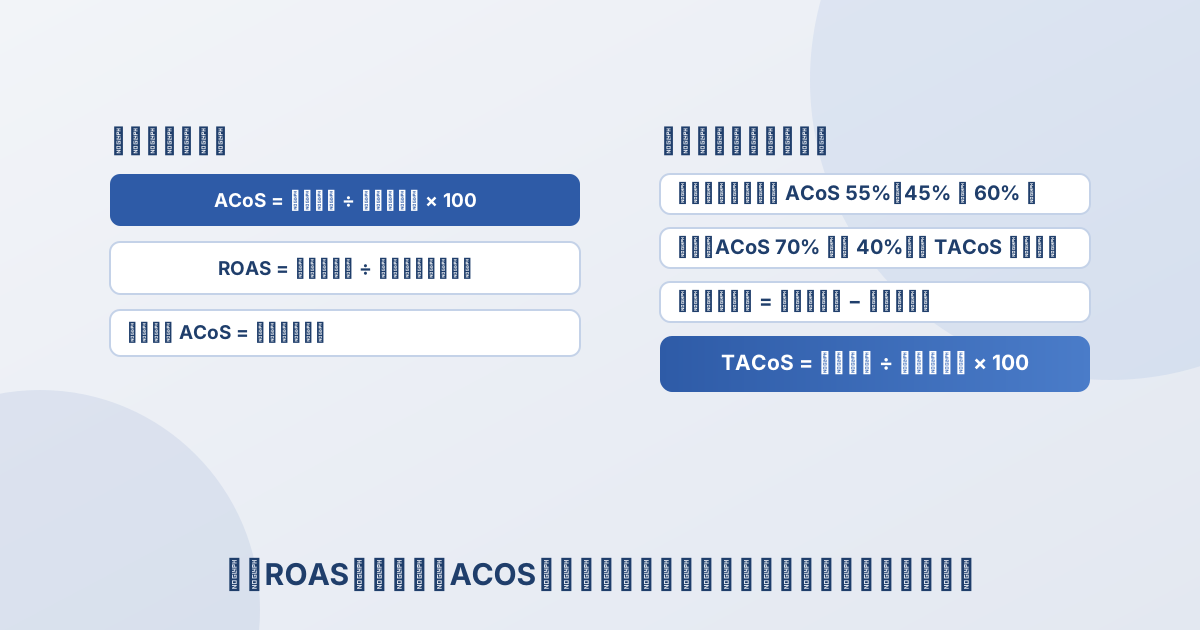
Amazon's official definition is ACoS = (ad spend ÷ ad-attributed sales) × 100, and ROAS is its inverse, ROAS = ad-attributed sales ÷ ad spend. The official example: USD 50 of ad spend generating USD 100 of ad-attributed sales is an ACoS of 50% and a ROAS of 2 (every USD 1 spent brings back USD 2 of sales).
The mechanism is that contribution per order from advertising = pre-ad profit - ad spend per order = selling price × (pre-ad profit margin - ACoS): when ACoS is below the pre-ad profit margin the contribution is positive, and when it is above, negative. Pre-ad profit margin here is the share of every USD 1 of selling price left after purchase cost, platform commission and fulfilment fees, before you pay for advertising. Amazon also states plainly that break-even ACoS is tied directly to your profit margin and that, to stay profitable, ACoS must be below the margin — otherwise you spend more on advertising than you earn.
But ACoS only looks at the ad-attributed sales slice and cannot see what advertising does for organic orders. To close that blind spot, look at TACoS = ad spend ÷ total store sales × 100, where the denominator is total store sales (ad-attributed plus organic). In the same account in the same month you can see a high ACoS and a low TACoS at once — which says that advertising is expensive on its own but is growing the whole store.
3. Evidence boundary: what these formulas can and cannot tell you
Amazon states plainly that there is no universal good ACoS figure: it depends on your industry, your company's size and your campaign frequency; and the denominator of ACoS is ad-attributed sales, not total store sales.
What can be verified word for word is the ACoS and ROAS formulas and the definition of break-even ACoS in Amazon's official guides, plus the third-party explanation of how TACoS is defined; what cannot be derived is any industry-average ACoS as your target, your product's real pre-ad profit margin (that needs your own purchase and fee data), or how much organic lift advertising actually creates. Note also that TACoS is not a standalone metric panel native to Amazon's back office but a convention used by sellers and service providers (this article follows the third-party explanation).
4. Reproducible analysis: break-even ACoS and the budget decision in two scenarios
Both scenarios below are explicitly labelled hypothetical examples, not data from any real store. Formula basis: break-even ACoS = pre-ad profit ÷ selling price; ad spend per order = selling price × ACoS; ad contribution per order = pre-ad profit - ad spend per order.
Scenario A: mature product with high margin, break-even ACoS 55% (hypothetical example)
Hypothetical example: selling price USD 20, purchase cost USD 6, Amazon fees USD 3, pre-ad profit USD 11.
With a selling price of USD 20, a purchase cost of USD 6 and Amazon fees of USD 3, pre-ad profit is USD 11 and break-even ACoS = 11 ÷ 20 = 55%. At ACoS 45%, ad spend per order = 20 × 45% = USD 9, so each order nets 11 - 9 = USD 2; at ACoS 60%, ad spend per order = 20 × 60% = USD 12, so each order loses 11 - 12 = USD 1.
Result: Break-even ACoS = 11 ÷ 20 = 55%; at ACoS 45% each order nets USD 2, at ACoS 60% each order loses USD 1. Decision: If ACoS is below 55%, keep advertising and you can add budget; if it is above 55%, lower bids first or cut the loss-making keywords.
Scenario B: new product with low margin, ACoS 70% above a 40% break-even (hypothetical example)
Hypothetical example: selling price USD 20, purchase cost USD 8, Amazon fees USD 4, pre-ad profit USD 8.
Break-even ACoS = 8 ÷ 20 = 40%. Looking at ACoS alone misjudges a new product: at ACoS 70% ad spend per order = 20 × 70% = USD 14 against pre-ad profit of USD 8, so advertising alone loses 14 - 8 = USD 6 per order. Suppose month one has ad spend of USD 2,800 and ad-attributed sales of USD 4,000 (ACoS = 2,800 ÷ 4,000 = 70%), organic sales of USD 1,000 and total store sales of USD 5,000, giving TACoS = 2,800 ÷ 5,000 = 56%; in month two ad spend is still USD 2,800 and ad-attributed sales still USD 4,000, while organic sales rise to USD 4,000 and total store sales to USD 8,000, giving TACoS = 2,800 ÷ 8,000 = 35%.
Result: Break-even ACoS = 8 ÷ 20 = 40%; at ACoS 70% advertising alone loses USD 6 per order, but TACoS falls from 56% to 35%. Decision: During the launch observation window ACoS may sit above 40%, but if TACoS fails to fall for four consecutive weeks or ad contribution for a whole month is negative, cut the budget or shut the campaign down.
5. Counter-examples and alternative readings: high ACoS is not always bad, and low ACoS does not always deserve more budget
One scenario that overturns 'low ACoS means add budget': advertising may simply be taking organic orders that would have happened anyway, so a low ACoS does not mean advertising created real incremental sales.
Conversely, high ACoS is not necessarily bad. During a new-product launch, advertising pushes keyword ranking and review counts up, and even if advertising alone loses money per order it may buy later organic growth — which is exactly what the falling TACoS in Scenario B expresses. Amazon also advises against watching ACoS alone and suggests looking at click-through rate, conversion rate and return on investment as well.
How to tell them apart? Read ACoS and TACoS together: if ACoS is high but TACoS is falling, advertising is levering store-wide growth and may be a reasonable staged investment; if ACoS is low but TACoS is rising, advertising is taking organic orders or the store-wide pie is not growing, and more budget is not necessarily worth it.
6. Action plan: which fields to collect, what to use as a baseline, when to stop
- Fields to collect: ad spend, ad-attributed sales, total store sales, organic sales, pre-ad profit margin (selling price less purchase cost, commission and fulfilment fees), refunds and returns.
- Compute a baseline: first compute each SKU's break-even ACoS = pre-ad profit ÷ selling price, then record current ACoS, ROAS and TACoS as the before-and-after comparison.
- Observation window: at least one full campaign cycle (for example 2 to 4 weeks), using enough clicks and orders to smooth daily noise and avoid misjudging on one or two orders.
- Stop conditions: when ACoS stays above break-even and TACoS stops falling, lower bids or cut the loss-making keywords; during a new-product launch, if TACoS fails to fall for four consecutive weeks, or ad contribution for a whole month (pre-ad profit × store-wide units - ad spend) is negative, cut the budget or shut down.
- Fill in data: in categories with high return rates, put net sales (sales - refunds) into the ROAS denominator and recalculate, and replace this article's assumed purchase and fee figures with the real ones from your own back office.
7. Limitations and uncertainty
Three unknowns are most likely to change the conclusion: first, the attribution window; second, whether returns have already been deducted from the denominator; third, how large the incremental effect of advertising on organic sales really is.
Amazon's ACoS/ROAS follow the platform's own attribution rules: different placements and different attribution windows (how many days after a click count) change the numbers; if returns are not deducted from ad sales, categories with high return rates will overstate the real return; and how many incremental orders advertising brings that would not have happened anyway cannot be fully separated from back-office reports alone, so separating them needs a controlled test or long observation of the organic share. What evidence would update the judgement: with your own per-SKU ad spend, net sales and returns data you can replace this article's hypothetical examples with real numbers and recalculate; with an on/off advertising test you can turn TACoS's 'may lever organic sales' from a guess into verifiable causation.
This article discusses a general advertising analysis method under Amazon's publicly documented ACoS and ROAS conventions, and does not imply that Nuozhou Digital Intelligence already provides advertising back-office data, attribution data or real-time campaign coverage for any platform.
Method and notes
Data basis for this article: ACoS = (ad spend ÷ ad-attributed sales) × 100 and ROAS = ad-attributed sales ÷ ad spend, together with the statement that break-even ACoS is tied to profit margin and that ACoS must sit below the margin to be profitable, are taken from Amazon Ads' official guides What is advertising cost of sales (ACOS)? and What is return on ad spend (ROAS)?; the derivation that break-even ACoS equals the pre-ad profit margin and the 55% example are consistent with the third-party Ad Badger piece Break-Even ACoS Formula for Amazon PPC; the TACoS definition of ad spend ÷ total store sales × 100 is taken from Ad Badger's Amazon TACoS, which states explicitly that TACoS is not a native Amazon back-office metric. All selling prices, purchase costs, fees, ad spend and sales in the scenarios are explicitly labelled hypothetical examples, not statistics from any platform or store.
The increment here is to turn Amazon's official ACoS and break-even definitions into a recalculable decision line, and to use TACoS to separate buying rank at a loss from simply losing money.
To put ad spend into the full profit account, see Cross-Border Profit Accounting: The Five-Step Subtraction from GMV to Net Profit; for exporting and retaining advertising reports, see Amazon Advertising Data Analysis: Unified Reports Cap Daily Pulls at 120 Days.
This article was assembled with the help of an automated research workflow and is based on the public sources listed at the end; it has not been manually reviewed.
References
- 1. Amazon Ads, What is advertising cost of sales (ACOS)? Calculation and tips (primary source: the ACoS and ROAS formulas, the link between break-even ACoS and profit margin, and the absence of a universal good ACoS figure): read the original, accessed 2026-11-19
- 2. Amazon Ads, What is return on ad spend (ROAS)? Definition, formula, calculation and tips (primary source: ROAS formula = ad revenue ÷ ad spend): read the original, accessed 2026-11-19
- 3. Ad Badger, Break-Even ACoS Formula for Amazon PPC (third-party methodology source: break-even ACoS = profit margin, and the USD 20 selling price with USD 11 pre-ad profit giving 55%): read the original, accessed 2026-11-19
- 4. Ad Badger, Amazon TACoS: Definition, Formula, Calculator & TACoS vs ACoS (third-party methodology source: TACoS = ad spend ÷ total store sales × 100, with examples): read the original, accessed 2026-11-19