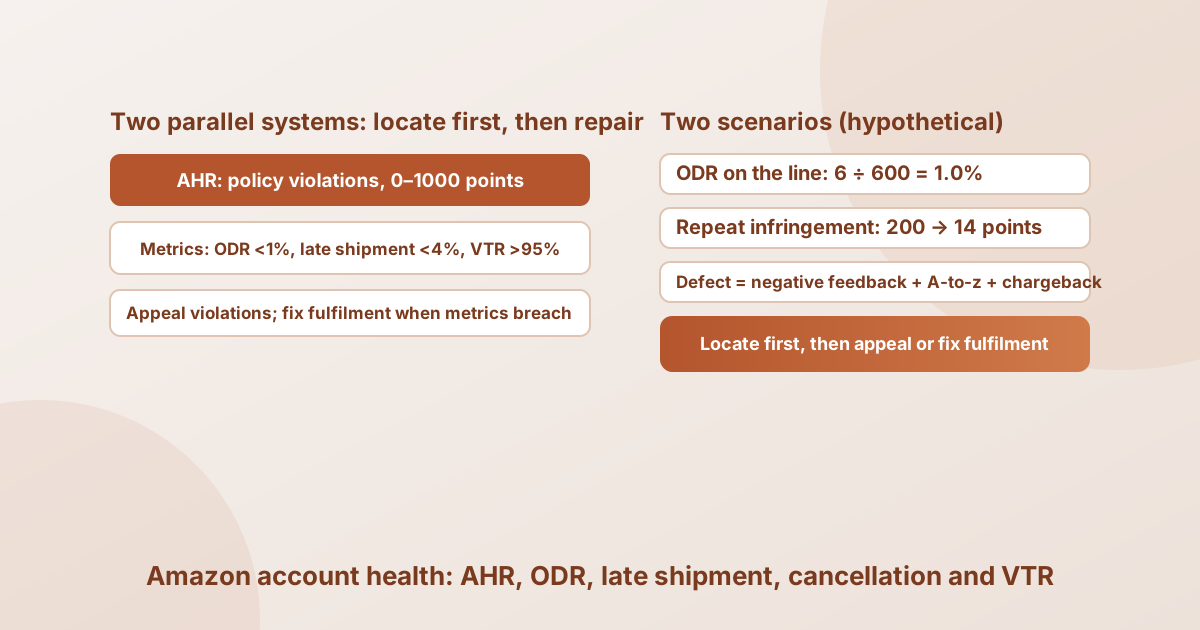
For a cross-border seller on Amazon’s US marketplace, account health is really two parallel systems that are easy to confuse. One is the Account Health Rating (AHR), which scores policy violations: a maximum of 1,000 points, green (Healthy) at 200–1,000, yellow (At Risk) at 100–199, red (Unhealthy) at 99 or lower, and all new sellers start at 200. The other is the set of performance metrics measured against fulfilment thresholds: order defect rate below 1%, late shipment rate below 4%, cancellation rate below 2.5% and valid tracking rate above 95%. When a warning arrives, the first step is not to rewrite the listing. It is to work out whether policy violations or fulfilment metrics are dragging the account down, because the repair actions are completely different. This article uses two clearly labelled hypothetical scenarios — an order defect rate sitting on the 1% line, and a repeat infringement whose deduction doubles — to show how to locate the problem, act, and set a stopping condition.
1. The decision: policy violation or performance metric?
When a cross-border seller on Amazon’s US marketplace receives an account health warning, the first question is whether policy violations (the Account Health Rating) or fulfilment performance metrics (order defect rate, late shipment rate, cancellation rate, valid tracking rate) are dragging the account down, because the repair actions are completely different.
The distinction matters because the two systems pull in opposite directions: policy violations call for an appeal on the Account Health page, supporting evidence, or removal of the offending listing, while a performance metric breach calls for changes to handling time, inventory, listing quality or the logistics provider. Treating an AHR deduction as an order defect problem, or treating a late shipment breach as a policy violation, wastes the appeal window and leaves the real cause untouched.
2. Mechanism: how the two systems trigger suspension risk
The Account Health Rating deducts points for policy violations, while metrics such as the order defect rate set thresholds for customer service performance; they trigger suspension risk through different channels — one measures whether you follow platform policy, the other whether you deliver an acceptable fulfilment experience.
The Account Health Rating (AHR) is a policy-compliance score. It groups violations such as intellectual property infringement, restricted products and authenticity under four severity levels — critical, high, medium and low — with each violation typically deducting 2 to 8 points. A critical violation takes the score straight to zero and gives a 3-day grace period. When the same policy is violated again, the negative point value doubles in some cases. At the same time, every 200 successfully fulfilled orders in the last 180 days adds 4 points, so the score scales with store size. Amazon also sets repeat-violation limits: a maximum of five repeat violations for infringement-related policies and two for the restricted products policy; reaching those limits can put the account at immediate risk of deactivation regardless of the score.
Performance metrics are a separate customer-service scorecard. The order defect rate (ODR) counts orders with at least one defect — negative feedback, an A-to-z Guarantee claim or a credit card chargeback — as a share of total orders over a 60-day window, and must stay below 1%. The late shipment rate counts orders confirmed shipped after the expected ship date, over 10-day and 30-day windows, and must stay below 4% for seller-fulfilled orders. The cancellation rate counts only seller-initiated cancellations and must stay below 2.5%. The valid tracking rate (VTR) counts shipments with a valid tracking number as a share of total shipments over 30 days and must stay above 95%. A breach does not necessarily suspend an account immediately, but an uncorrected breach accumulates into account risk.
| Metric | Target | Window | What it counts |
|---|---|---|---|
| Order defect rate (ODR) | Below 1% | 60 days | Defect = negative feedback / A-to-z claim / credit card chargeback |
| Cancellation rate | Below 2.5% | Seller-initiated cancellations | Excludes buyer cancellations |
| Late shipment rate | Below 4% | 10-day and 30-day | Seller-fulfilled orders only |
| Valid tracking rate (VTR) | Above 95% | 30 days | Seller-fulfilled orders only |
| On-time delivery rate (OTDR) | Above 97% | Seller-fulfilled | No penalty at present |
3. Evidence boundary: what these thresholds can and cannot tell you
What can be verified word for word here is the three-tier 0–1000 Account Health Rating with a 200 starting score for new sellers, and the thresholds and measurement windows for each performance metric as published on Amazon’s pages; what cannot be inferred is the exact deduction for an individual violation, or the precise moment at which a metric breach triggers enforcement.
Three common misuses. First, AHR deductions are published only as a typical 2-to-8-point range, not a fixed value per violation; Amazon decides the actual deduction by severity and whether the violation repeats. Second, the order defect rate is a rolling 60-day window, so historical defects do not disappear immediately, and a change in the order denominator can amplify or dilute the same defect. Third, the AHR measures policy-compliance risk while the performance metrics measure customer-service risk; a green AHR does not mean the ODR is within target.
4. Worked analysis: two account health calculations
Both scenarios below are clearly labelled hypothetical examples, not data from any real store; replace the inputs with your own Seller Central figures and recalculate. Order defect rate equals defect orders divided by total orders, with a target below 1%; at 600 orders in the 60-day window and an unchanged denominator, each additional defect raises the ODR by 1 ÷ 600, or about 0.17 percentage points.
Scenario A: the ODR sits on the line and fulfilment is dragging the account (hypothetical example)
Hypothetical example: a US marketplace seller receives 600 orders in 60 days, of which 6 have defects — 2 negative feedback, 3 A-to-z Guarantee claims and 1 credit card chargeback.
The order defect rate is 6 ÷ 600 = 1.0%, exactly on the 1% line; one more defect lifts it to 7 ÷ 600 ≈ 1.17%, clearly above target.
Work the three A-to-z claims first: if 2 can be settled and withdrawn, defects fall to 4 and the ODR returns to 4 ÷ 600 ≈ 0.67%. If the defects cluster around quality complaints for one SKU, delisting that SKU is more effective than handling orders one by one.
Scenario B: a repeat infringement doubles the deduction and the AHR is dragging the account (hypothetical example)
Hypothetical example: a new seller starts at 200 points and receives violations under the same infringement policy within 180 days, assuming a typical 6-point deduction for the first violation and a doubling for each repeat.
After the first 6-point deduction the score is 194; the second violation deducts 12 points and leaves 182. Across five violations of the same policy the deductions run 6, 12, 24, 48 and 96 points, leaving 14 points — inside the red Unhealthy band.
Appeal or delist at the second repeat violation rather than waiting for the deductions to compound toward the five-repeat limit within 180 days. Prioritise the violation with the highest severity.
Sensitivity: Scenario A is most sensitive to order volume — the same 6 defects produce an ODR of 2.0% if the order count halves from 600 to 300. Scenario B is most sensitive to the actual deduction per violation — Amazon publishes only a typical 2-to-8-point range; if the first deduction were 4 points instead of 6, five violations would total 4 + 8 + 16 + 32 + 64 = 124 points, yet either way five violations of the same policy still reach the five-repeat limit within 180 days.
5. Counter-case and alternative explanations: when a breach does not mean rewriting the listing
One scenario that overturns the “breach means fix the listing” rule: the defects may come from a one-off credit card chargeback or malicious negative feedback rather than product quality. Rewriting the listing will not fix a chargeback rate; the first step should be to check the chargeback reason and appeal.
Another alternative explanation is timing: the order defect rate is a lagging 60-day rolling metric, so defects from a product problem you have already fixed remain in the window for a while. Conversely, an account that has just scaled its orders quickly can dilute the same few defects into a lower rate. Read the ODR together with two other things — the mix of defects (how the defects split between negative feedback, A-to-z claims and chargebacks) and the last 14 days’ trend — not just the 60-day total. How to tell them apart: if defects concentrate in A-to-z claims and chargebacks, check order status and appeals first; if they concentrate in negative feedback for one SKU, check the listing copy and product quality; if they are spread out and rise in proportion to sales, the problem is more likely fulfilment or customer-service response.
6. Action plan: what to collect, what baseline to use, when to stop
Open the Account Health page and record separately the AHR score and open violations, the ODR and its defect mix (negative feedback, A-to-z claims, credit card chargebacks), the late shipment rate, the cancellation rate and the valid tracking rate — then decide whether policy violations or performance metrics are the problem.
- Fields to collect: AHR score; open violations (policy name, severity, repeat status); order defect rate and its three components; late shipment rate; seller-initiated cancellation rate; valid tracking rate; on-time delivery rate.
- Set a baseline: record the current AHR score and each metric before any appeal or fulfilment change; keep the 60-day ODR defect mix alongside the 14-day trend.
- Observation windows: ODR over 60 days but read with the 14-day trend; late shipment rate and VTR over 30 days; cancellation rate for seller-initiated cancellations; AHR violations and deductions over 180 days.
- Stopping conditions: handle the highest-severity policy violation first, and appeal or delist at the second repeat violation instead of waiting for deductions to double; when a performance metric is breached and one SKU accounts for most negative feedback and A-to-z claims, delisting that SKU is more effective than handling orders one by one.
- Missing data: once you have the live score and violation deductions from your own Account Health page, replace the hypothetical inputs in this article and recalculate.
7. Limitations and uncertainty
Three unknowns are most likely to change the conclusion: the exact deduction for each violation is not a published fixed value; the order defect rate is a lagging 60-day rolling metric; and Amazon retains discretion over when a metric breach triggers enforcement.
What evidence would update the judgement: live scores and per-violation deductions from your own Account Health page would turn Scenario B from a hypothetical into an actionable appeal list; SKU-level negative feedback, A-to-z and chargeback detail would show which SKU to delist in Scenario A. Amazon also states that regardless of the AHR score, it may deactivate an account immediately if it suspects fraudulent, deceptive, illegal or otherwise harmful activity — so a passing score is not absolute safety.
This article discusses a general analytical method under Amazon’s publicly documented Account Health Rating and performance metric definitions; it does not mean Nuozhou Digital Intelligence provides any platform’s seller-back-office data, suspension alerts or real-time coverage.
Methodology and disclosure
Data definitions in this article: the 0–1000 Account Health Rating with its three bands, the 200-point starting score for new sellers, four severity levels, typical 2–8-point deductions, doubling on repeat violations, 4 points per 200 fulfilled orders, and the limits of five infringement-related and two restricted-product repeat violations come from Amazon’s “Account Health Rating program policy and FAQ” (accessed 2026-11-19); the thresholds of order defect rate below 1% (60 days), late shipment rate below 4%, cancellation rate below 2.5%, valid tracking rate above 95% and on-time delivery rate above 97% come from Amazon Seller Central’s “How to Maintain Amazon Seller Account Health (Part I)” and “Working on Your Seller Performance Metrics to Prevent Account Suspension” (accessed 2026-11-19). All order counts, defect counts and deduction values in the scenarios are clearly labelled hypothetical examples, not statistics from any platform or store.
The increment here is to separate Amazon’s two parallel and easily confused account-health systems — the Account Health Rating, which scores policy violations, and the performance metrics, which set fulfilment thresholds — and to give a conditional method for locating which system is dragging the account down before deciding whether to appeal or change fulfilment.
For the wider Amazon measurement framework, see Amazon Data Analysis; for definitions and citation conventions used across NWi research, see E-commerce Data Definitions and Methods; for related market research, see Cross-Border E-commerce Reports.
This article was prepared with the assistance of an automated research workflow and is based on the public sources listed at the end; it has not been reviewed by a human editor.
Sources
- 1. Amazon Seller Central, “How to Maintain Amazon Seller Account Health (Part I)” (primary source: AHR bands, definitions and thresholds for ODR, cancellation rate, late shipment rate, valid tracking rate and on-time delivery rate): read the source, accessed 2026-11-19
- 2. Amazon, “Working on Your Seller Performance Metrics to Prevent Account Suspension” (primary source: performance targets and the formulas for ODR, late shipment rate, cancellation rate and return dissatisfaction rate): read the source, accessed 2026-11-19
- 3. Amazon, “Account Health Rating program policy and FAQ” (primary source: 0–1000 three-band score, four severity levels, typical 2–8-point deductions, doubling repeats, 4 points per 200 orders, repeat-violation limits): read the source, accessed 2026-11-19