Pick the platform first, then the site and category
The same category has different demand, price bands and competitive structure on Amazon, Shopee, Lazada, TikTok Shop, Temu and Coupang. Break it down by platform and site first, then make product selection and competitor judgments.
The short answer: NWi CrossborderGo puts market data from multiple marketplaces into one consistent methodology, with drill-down by site, category, brand, store and product. The platforms, sites and historical depth available depend on the modules you activate.
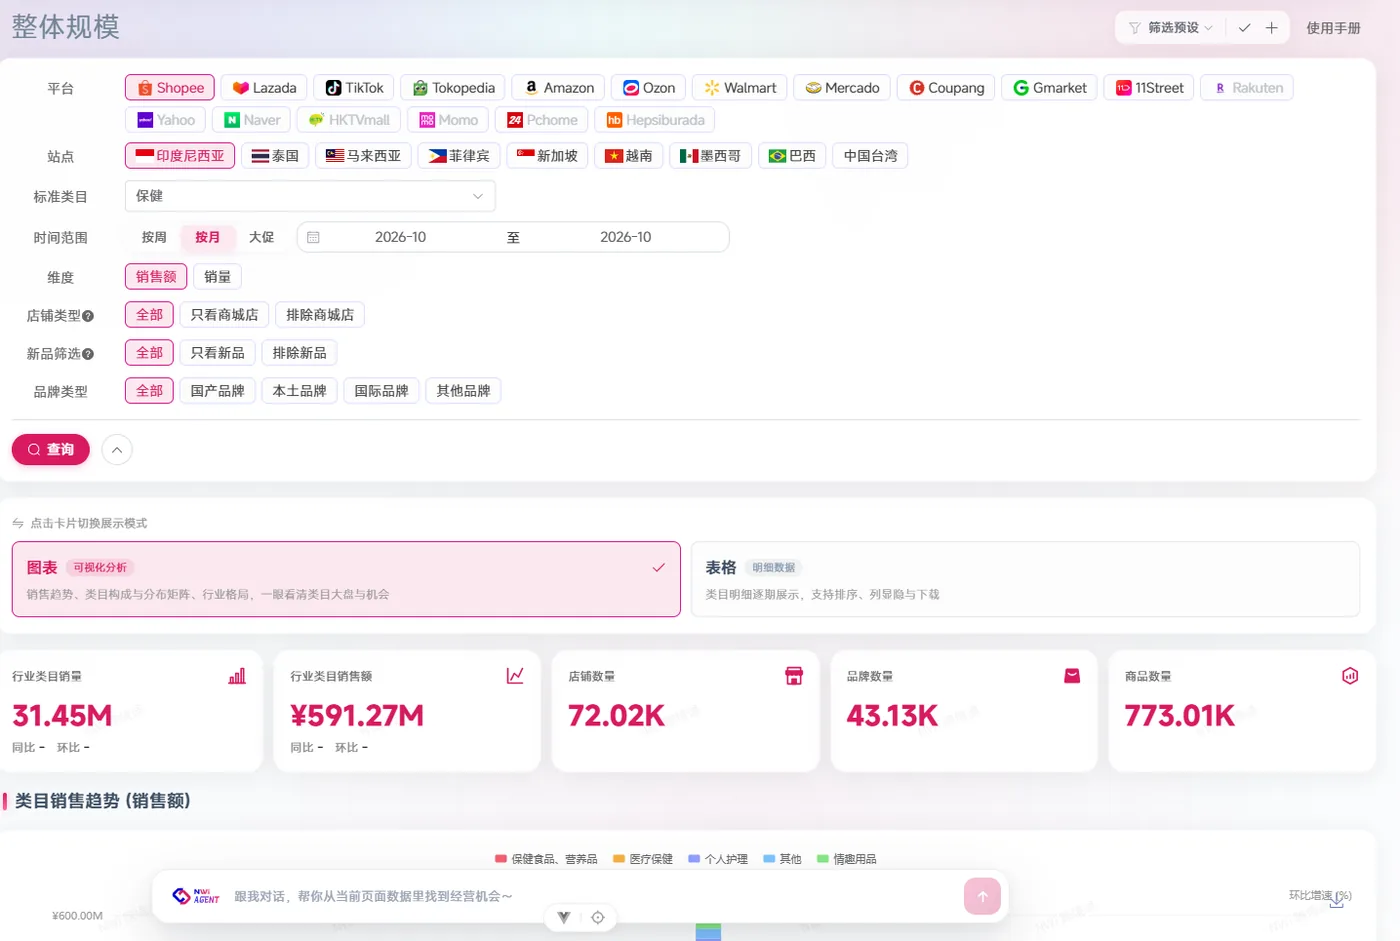
Browse by platform
Every platform page states clearly what questions it answers, which metrics it uses and what its limits are.
Amazon analytics
Amazon analytics puts site, category, ASIN, price, reviews and advertising into one consistent methodology to judge whether demand is stable, whether competition is concentrated, and whether there is still profit per unit. NWi CrossborderGo brings Amazon sales trends, price bands and brand concentration…
View the Amazon page →TikTok Shop analytics
TikTok Shop analytics puts products, short videos, livestreams and creators into a single chain: who made the product take off, how much sales they drove, and how refunds and repeat purchases look. NWi CrossborderGo brings TikTok Shop product trends, creator performance and sales data…
View the TikTok Shop page →Shopee analytics
Shopee analytics has to be broken out by country site: the same category has completely different demand, price bands and competitive structure in Indonesia, Thailand and Vietnam. NWi CrossborderGo puts category scale, brand/store/product rankings and price bands for each Shopee site into one consistent methodology…
View the Shopee page →Lazada analytics
The focus of Lazada analytics is category structure, brand/store concentration and price bands, not just total sales on one site. NWi CrossborderGo breaks Lazada data down by country, category, brand, store and product, helping teams judge which market still has room for new products…
View the Lazada page →Temu analytics
Temu analytics cannot look at GMV alone; price bands, category competition, product lifecycle and fulfillment cost have to be considered together. NWi CrossborderGo helps teams observe category scale, product price distribution and top-product changes across Temu sites, and judge whether, under low-price competition, there is still…
View the Temu page →Coupang analytics
Coupang analytics has to look at Korean-language product attributes, price, specifications, fulfillment and return costs. NWi CrossborderGo observes Coupang's sales structure by category, brand, store and product, helping teams judge whether the Korean market is worth entering and which specifications fit local demand better…
View the Coupang page →Coverage is not the same as deliverable
"Content coverage" and "commercial data coverage" are two different things. Platforms, sites, historical periods and fields are subject to the coverage matrix confirmed in the contract.
View the coverage matrix →Confirm the methodology before comparing prices
Estimation methodologies differ across platforms and sites. Look at data definitions and limits first, then judge whether the tool fits your decision scenario.
View data methodology →Not sure which platform to look at first?
Send us your category and target countries, and we will run a platform/site screen with real data.
E-commerce data, methods and reports
Explore NWi EC Data product pages, platform coverage, data definitions and published research. Each source states its scope, definitions and limits.