One dashboard to see
sales, prices and competitors across marketplaces
Category, brand, store and product data for Amazon, Shopee, Lazada, TikTok Shop, Temu and Coupang, compared on one consistent basis. First see which site is worth entering, then decide how much stock to prepare.
In multi-marketplace operations, the most expensive thing is a wrong call, not the tool
You switch between dashboards, and the definitions still don't match
Amazon uses one set, Shopee another, TikTok Shop another. The same category on a different marketplace has a completely different price band and competitive structure.
Competitors change prices or launch products, and you are always the last to know
Screenshots, bookmarks, manual notes — by the time you notice, the window has passed. You need a fixed competitor set and continuous visibility into share, price and new launches.
Reports never end, and decisions still rely on gut feel
Data piles up in Excel, but without a consistent basis you cannot explain to your boss or client where the numbers come from.
See the market, see competitors, use AI
See the market
Global overview, industry analysis, subcategory and attribute analysis to decide which marketplace, site and category are worth entering.
Explore market analysis →See competitors
Brand, store and product rankings and price bands, with continuous tracking of who is growing, who is cutting prices and who is launching new products.
Explore competitor analysis →Use AI
AI insight, AI sales videos, AI product images, AI titles, AI PPT and NWi Skill turn data into deliverables.
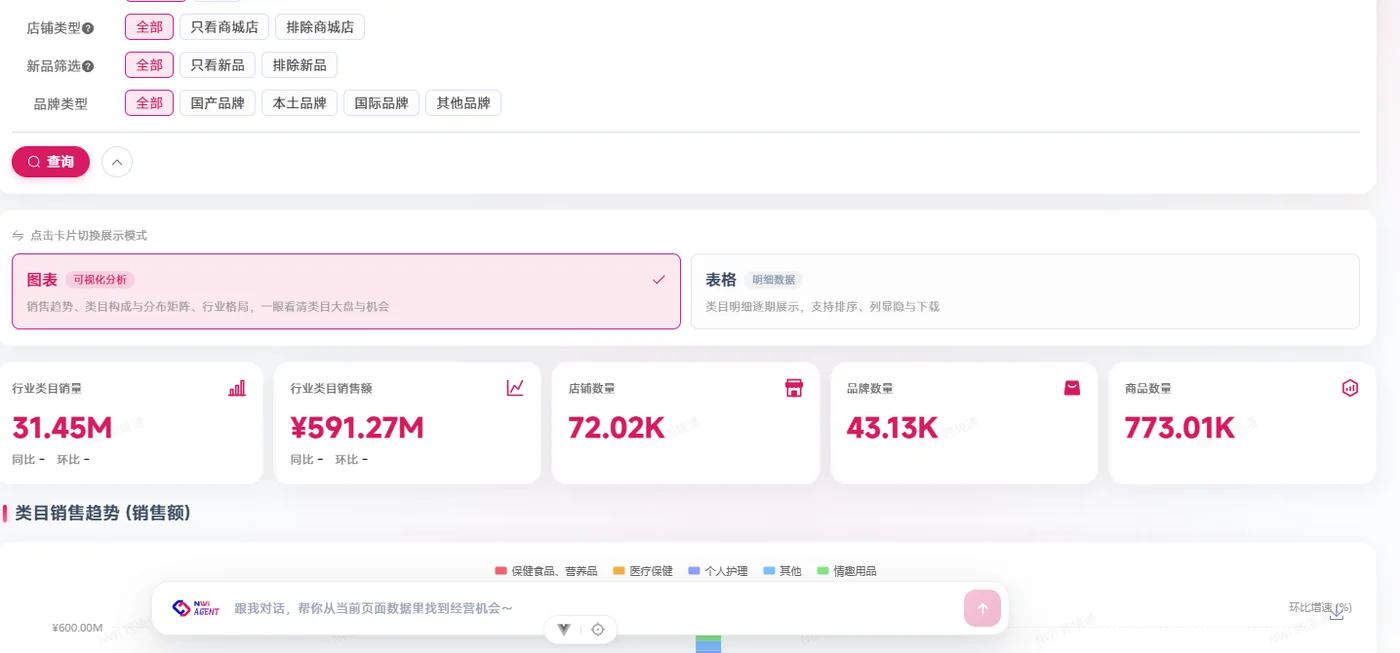
Explore AI capabilities →Real product screens, not concept art
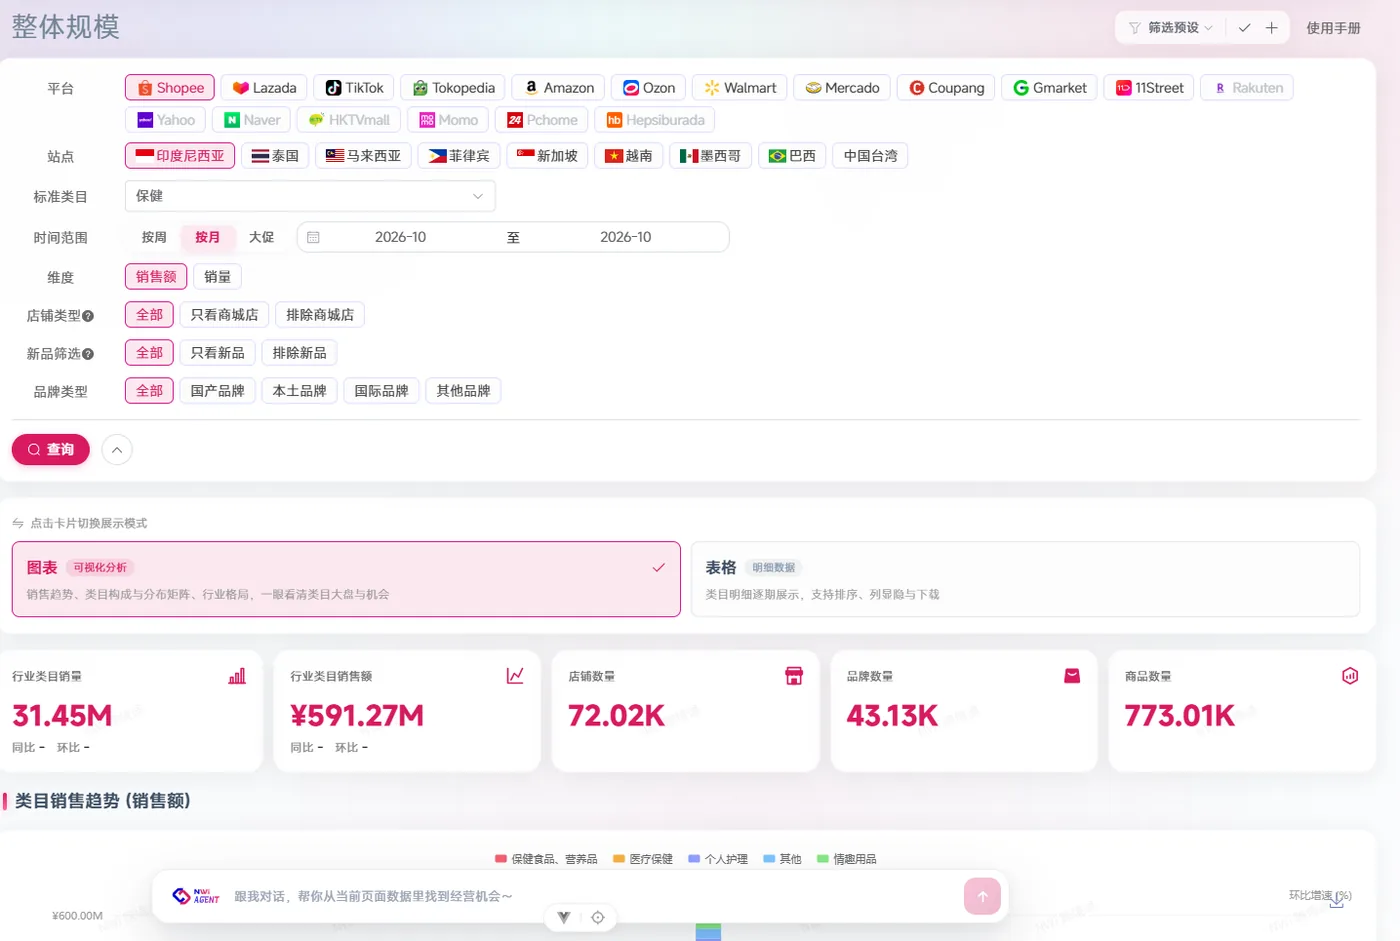
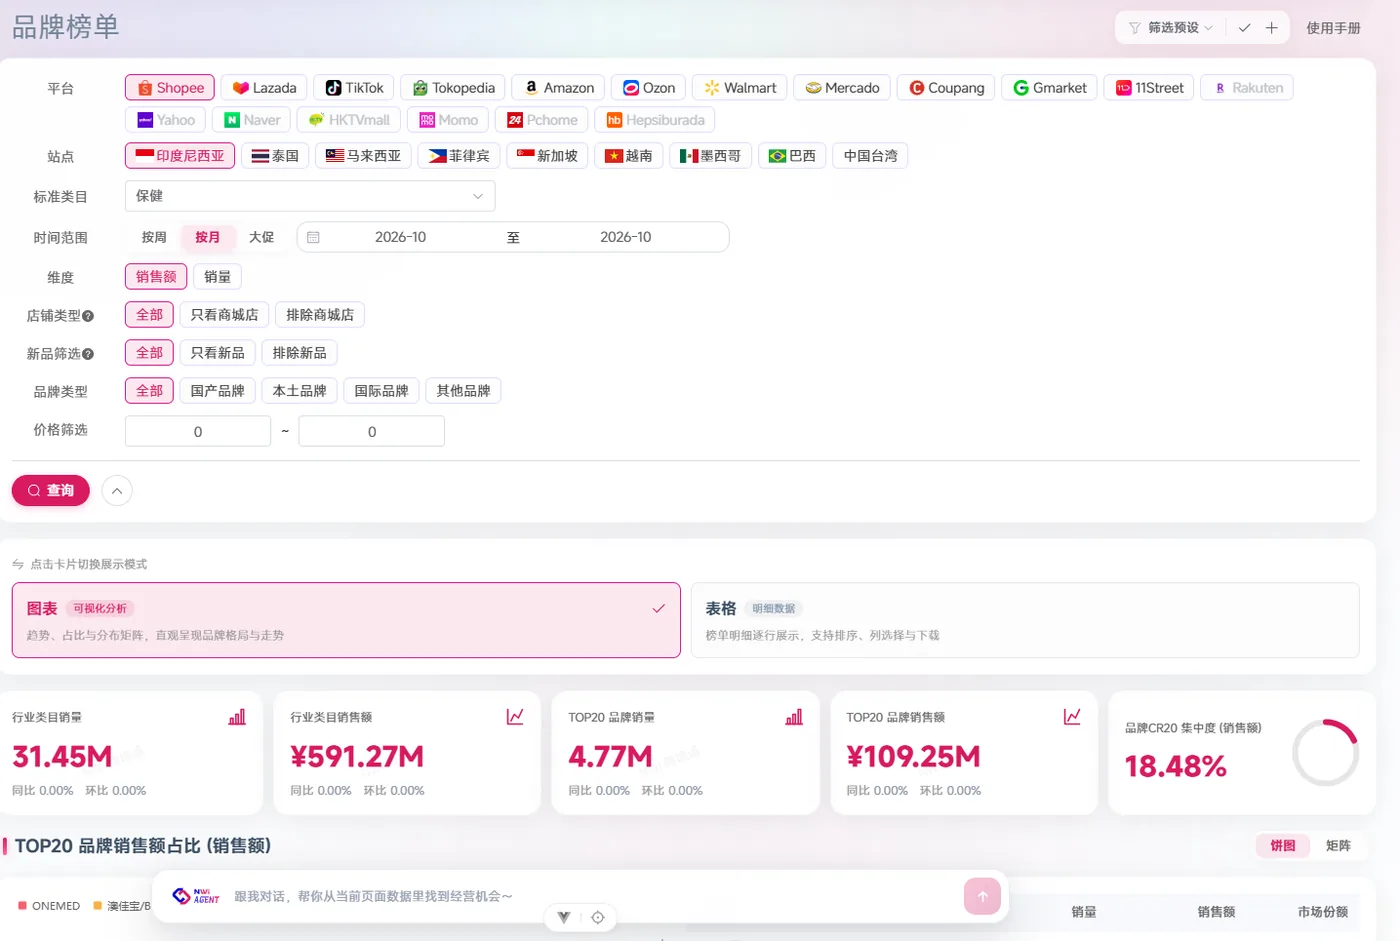
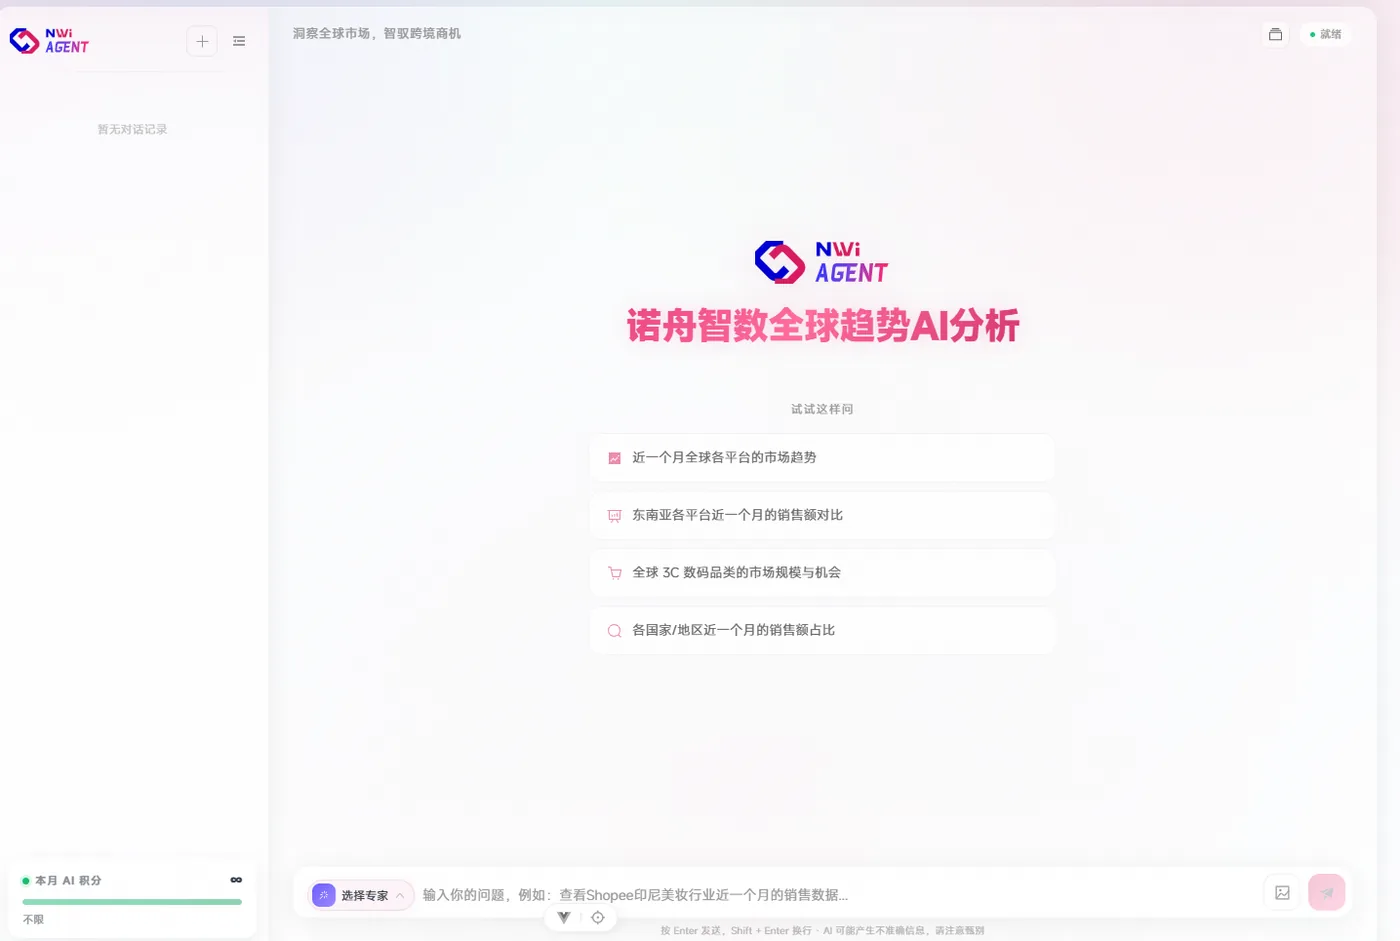
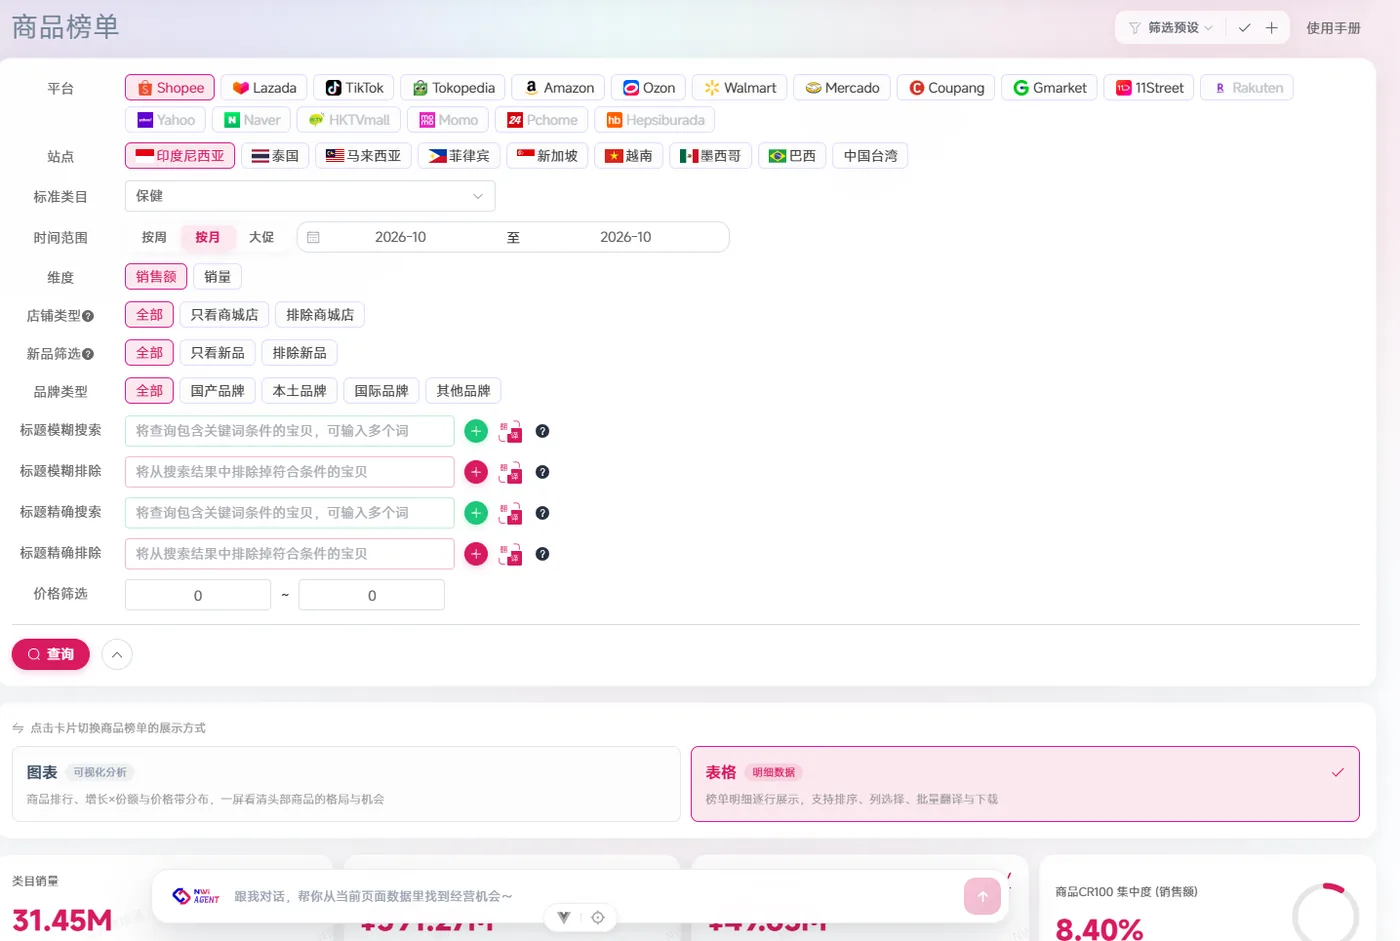
Use the data without opening the dashboard
From data queries to content production, hand repetitive work to AI; key conclusions still return to charts and definitions for verification.
AI insight
Query multi-marketplace sales, prices and competitors in natural language and get charts and conclusions back.
AI sales videos
From product information to three script options and sample videos: review the data strategy before shooting.
AI product images
Main images, white-background images, lifestyle images and selling-point images, localized by market and marketplace.
AI PPT data fill
Keep the layout and let the data update automatically; every number keeps its source and update time.
Who uses NWi CrossborderGo
Brand global expansion leads
Need to decide which market to enter and how many resources to commit, and to justify the call to management.
E-commerce operations leads
Need continuous visibility into competitor prices, new launches and share to shorten the review cycle.
Product selection / category managers
Need to compare categories, price bands, attributes and competitors on one consistent basis.
Data analysts / agencies
Need less cleaning and stitching, and more time for judgement and reporting.
Not another single-marketplace plugin
| Dimension | NWi CrossborderGo | Single-marketplace plugin | General BI / Excel |
|---|---|---|---|
| Multi-marketplace comparability | ✓ Same basis | Narrow coverage; switching required | You connect the data yourself |
| Market / competitor data | ✓ Category / brand / store / product | Depth on one marketplace | Only your own operating data |
| AI data queries | ✓ AI insight / Skill | Limited | None |
| Time to adopt | Medium; definitions need to be understood | Low; install and use | High; modeling required |
| Best for | Multi-marketplace brands / agencies / data teams | Single-marketplace sellers | Companies with a data team |
If you sell on only one marketplace, a single-marketplace tool may suit you better. If you operate on several, NWi CrossborderGo solves “comparability” and “fewer spreadsheets”.
Choose platforms and sites first, then add modules
Starter / advanced small merchants
Single platform, few sites, single category — for validating one market first.
Book a demoBasic / advanced mid-market
Multiple sites, with category and brand/store/product modules combined per contract — for teams operating in several markets.
Book a demoAdvanced / VIP brands
Multiple teams, custom data scope, API/Skill access and a dedicated customer success manager.
Book a demoLatest research
Platform fees, category trends and market changes, newest first.
Alibaba.com logistics evidence spot checks move to cumulative penalties: penalties start at 15 shipments, 30-day appeals, counted per main account — how exporters can avoid deductions or losing EXW draft access
Alibaba.com has changed logistics evidence spot checks from per-shipment deductions to cumulative penalties: 30-day appeals, counted per main account, penalties starting at 15 shipments and EXW draft access suspended at 60. This article reconstructs the official penalty table into recalculable confirmed-exception metrics and uses two hypothetical scenarios to demonstrate the thresholds around 15 and 30…
Read the full article →Black Friday and Cyber Monday data analysis: Amazon's Black Friday week starts November 19, with 12 days of daily deals and two drop periods for Black Friday/Cyber Monday, plus US October retail +0.2% — how cross-border sellers can set price floors, deal cadence and ad budget caps
Based on Amazon's official Black Friday week mechanics and actual US October retail data, this article first explains how the 12-day window and two drop periods disperse traffic peaks, then compares the Census and NRF retail definitions and translates the +0.2% headline and category divergence into per-SKU…
Read the full article →Ozon data analysis: manual push notifications rise to RUB 3 per recipient from December 3 while automatic pushes stay at RUB 2 — how Russia-site sellers can recalculate reach costs using historical seasonality coefficients
From December 3, Ozon will charge RUB 3 per recipient for manual (one-off) pushes, keep automatic pushes at RUB 2 and remove the seasonality coefficient for both notification types. This article uses the official current formula (RUB 2 × recipients × seasonality coefficient) to reconstruct two hypothetical scenarios…
Read the full article →Frequently asked questions about NWi CrossborderGo
What is NWi CrossborderGo?
NWi CrossborderGo (NWi EC Data) is a multi-platform cross-border e-commerce data platform from NWi. It covers market, brand, store and product data for Amazon, Shopee, Lazada, TikTok Shop, Temu, Coupang and other marketplaces, with AI data queries, competitor monitoring and reports.
How is it different from SellerSprite and Oalur?
Single-marketplace tools are usually deeper on Amazon or one specific marketplace; NWi CrossborderGo focuses on comparable definitions across marketplaces and sites, plus AI data queries and reporting. Which one to choose depends on your marketplace mix and team size.
Which platforms and sites do you cover?
The product backend currently offers 18 marketplaces. The exact commercial coverage, sites, historical period and fields are subject to the coverage matrix confirmed in your contract. We do not treat “content coverage” as “commercial data coverage”.
How often is the data updated?
Public market data is updated monthly, usually on the 10th–15th of each month for the previous month's data. Higher-frequency monitoring must be confirmed in the contract.
Is the data accurate?
Market data is an estimate based on public product information and is not equivalent to marketplace settlement or seller back-office data. We explain metric definitions, samples and limits on the data methodology page; we recommend cross-checking trial data against your own back-office data.
Can I try it?
We offer a 15-minute demo and sample data for enterprise teams; we do not offer a full-featured free trial to individuals. Bring your marketplace, site and category, and we will demo real data.
How is pricing structured?
Pricing is based on a combination of platforms, sites, categories and brand/store/product modules, as an annual subscription. The pricing page lists module reference prices; the actual combination is subject to a sales quote.
Can I connect the data to AI?
Yes. NWi Skill puts data querying into AI assistants, and AI insight supports natural-language questions. Deeper API/MCP access must be confirmed separately.
Bring your marketplaces and categories, and we will demo with real data
15 minutes: see the market, price bands and competitors first, then decide whether to go deeper.
E-commerce data, methods and reports
Explore NWi EC Data product pages, platform coverage, data definitions and published research. Each source states its scope, definitions and limits.