Brand, shop and item analysis: see who is growing and who is cutting prices
Brand, shop and item analysis splits the competitive landscape into three layers: brands for share, shops for operations, items for price and selling points. NWi CrossborderGo ranks by sales, units, growth and price band, helping teams find benchmark targets and repeatable actions.
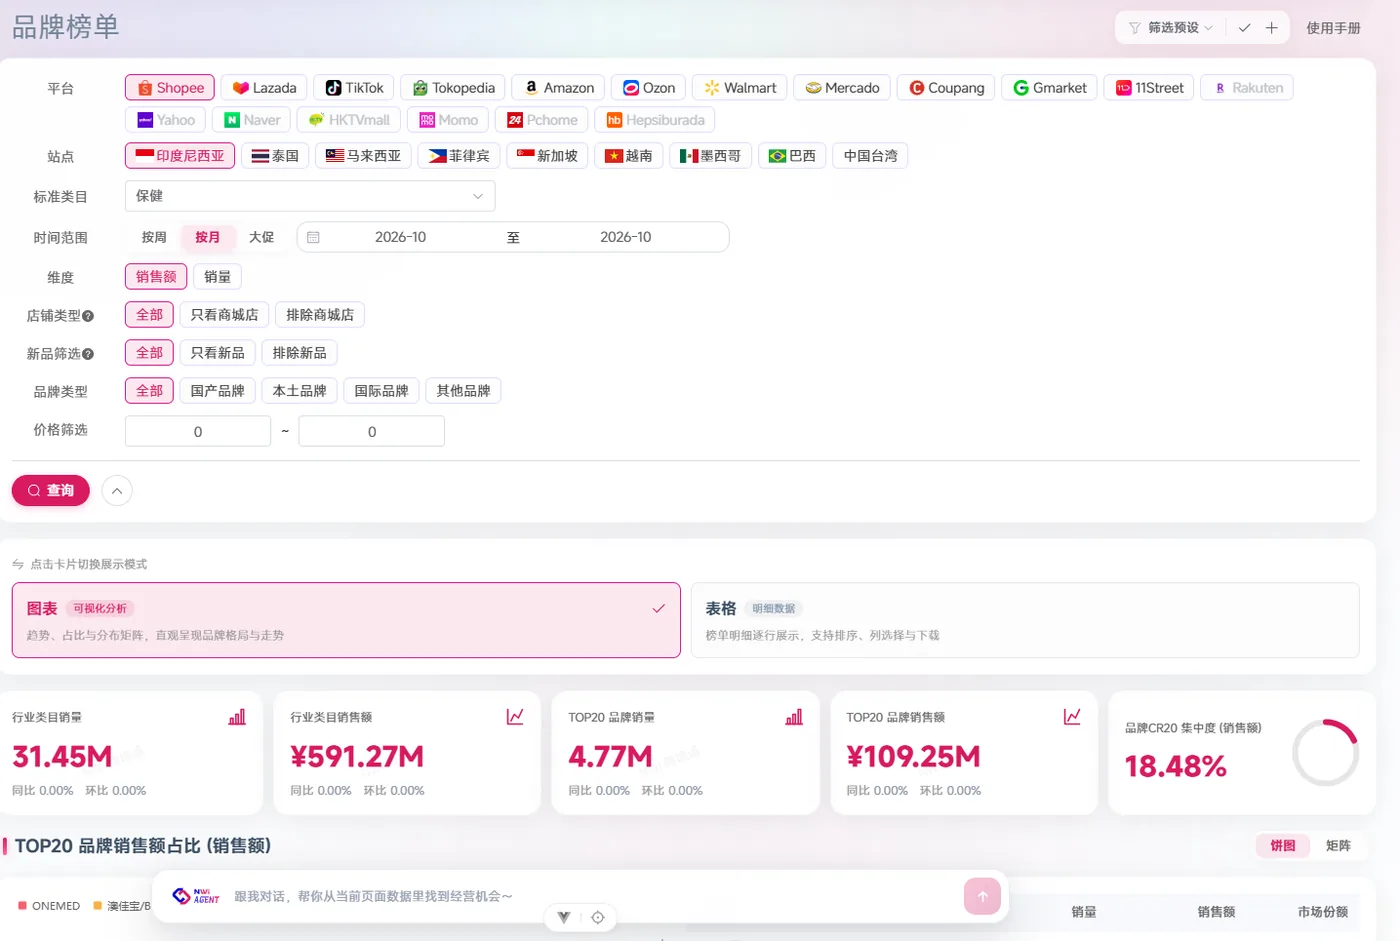
Questions you can answer with it
Are the leading brands rising or falling recently?
Break it down with the same metrics and period instead of looking at a single total.
Which shop is growing fastest?
Break it down with the same metrics and period instead of looking at a single total.
What price range are competitors' new products in?
Break it down with the same metrics and period instead of looking at a single total.
Who has the most items in the same price band?
Break it down with the same metrics and period instead of looking at a single total.
Is the change in brand share promotional or structural?
Break it down with the same metrics and period instead of looking at a single total.
How to use it
Define the targets
Choose 3–5 direct competitor brands or shops to avoid noise from too large a sample.
Set metrics and frequency
Fix metrics such as sales, units, average price, share and new item count, and review them monthly or weekly.
Review actions
Map competitor prices, launches, promotions and share changes to build an actionable list.
Metrics and definitions
| Metric | Definition |
|---|---|
| Brand share | Brand sales ÷ category sales. |
| Shop share | Shop sales ÷ category sales. |
| Item sales | Estimated sales of an item during the observation period. |
| New item count | Number of items that appeared for the first time during the observation period. |
| Price change | Change in an item's average selling price or list price during the observation period. |
Related pages
Frequently asked questions
How are the rankings sorted?
You can sort by sales, units, growth and other dimensions; conclusions may differ by dimension, so review them together.
Can I monitor specific brands?
Yes, you can build a watchlist by brand; the number of brands, fields and frequency depend on the module you subscribe to.
What is the difference between brand and shop rankings?
Brands reflect market share and product portfolio, while shops reflect operating capability and channel structure; one brand may operate multiple shops.
Can item rankings show price changes?
Item prices and ranking changes are available when time-series fields are included; daily monitoring must be confirmed separately.
Want to try it with a real category?
We will demo this capability using your marketplace, site and category.
E-commerce data, methods and reports
Explore NWi EC Data product pages, platform coverage, data definitions and published research. Each source states its scope, definitions and limits.