Industry analysis: category size, brand concentration and price bands
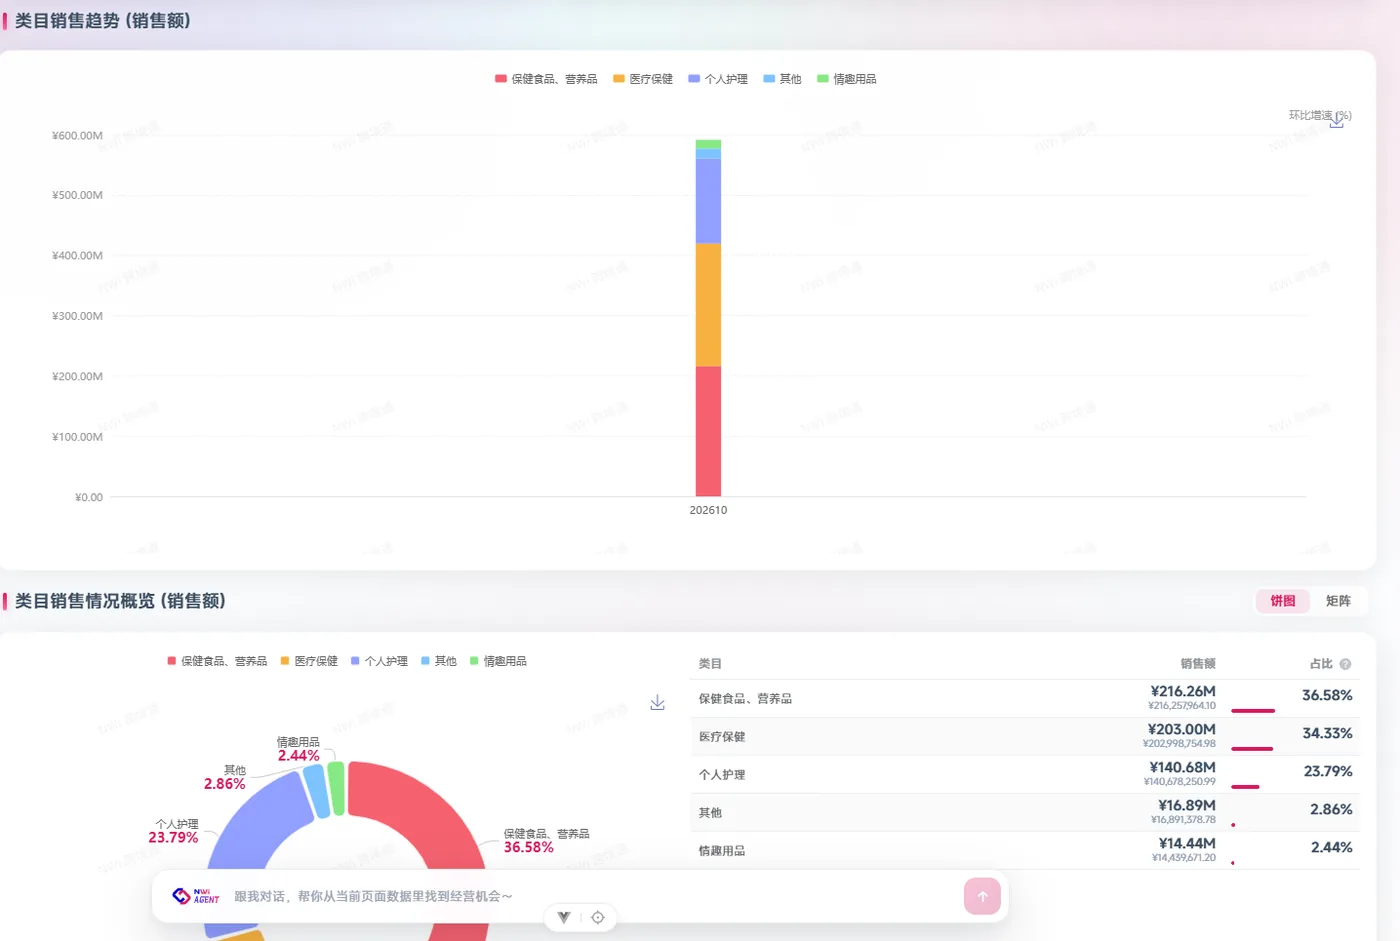
Industry analysis breaks a category into size, growth, brand concentration, price bands and item structure to judge whether it is worth entering and where to start. NWi CrossborderGo provides overall size, brand, shop and item rankings, subcategory and attribute analysis, suitable for product research and competitor research.
Questions you can answer with it
Is this category dominated by a few leaders or fragmented?
Break it down with the same metrics and period instead of looking at a single total.
Which subcategory or price band is driving growth?
Break it down with the same metrics and period instead of looking at a single total.
Is there still room for new products?
Break it down with the same metrics and period instead of looking at a single total.
Which attribute combination generates the highest sales?
Break it down with the same metrics and period instead of looking at a single total.
Has the price war already eroded margins?
Break it down with the same metrics and period instead of looking at a single total.
How to use it
Look at the market
Start with category sales, units and growth to confirm whether demand exists.
Break down the structure
Decompose growth sources by subcategory, brand, price band and attribute.
Define the entry point
Find the segment with demand, unsaturated competition and a price band that covers costs.
Metrics and definitions
| Metric | Definition |
|---|---|
| CR5/CR10/CR20 | Share of category sales held by the top 5, 10 and 20 brands. |
| Price band share | Share of sales or units by price band. |
| Attribute sales | Sales split by attributes such as specifications, materials and functions. |
| New product share | Share of items in the category that appeared for the first time during the observation period. |
Related pages
Global overview
Continue to the next page on this topic.
Open page →Brand, shop and item analysis
Continue to the next page on this topic.
Open page →Cross-border e-commerce product research process
Continue to the next page on this topic.
Open page →Pricing and modules
Continue to the next page on this topic.
Open page →Frequently asked questions
Can industry analysis answer “is it worth entering”?
It provides evidence such as size, growth, concentration and price bands, but the decision also depends on your supply chain, fulfillment costs and profit model.
Does a high CR20 mean I cannot enter?
Not necessarily. A high CR20 means the leaders are strong, but gaps in price bands or attributes may still allow entry; a low CR20 means the market is fragmented, but you should also check whether it is prone to commoditization.
Which dimensions does attribute analysis cover?
Coverage depends on marketplace fields and cleaning rules; common dimensions include specifications, materials, functions and packaging. Specific dimensions depend on the module you subscribe to.
What is the difference from marketplace pages?
Industry analysis examines structure across categories, while marketplace pages drill into items and competitors on a specific marketplace; use them together.
Want to try it with a real category?
We will demo this capability using your marketplace, site and category.
E-commerce data, methods and reports
Explore NWi EC Data product pages, platform coverage, data definitions and published research. Each source states its scope, definitions and limits.