AI insight: query cross-border sales, prices and competitors through conversation
AI insight turns natural-language questions into data queries: you can ask “compare sales across Southeast Asian marketplaces over the past month” and the system returns charts and conclusions. NWi CrossborderGo puts AI global trends, AI industry insight and NWi Skill in the same data context, reducing time spent opening dashboards and building spreadsheets.
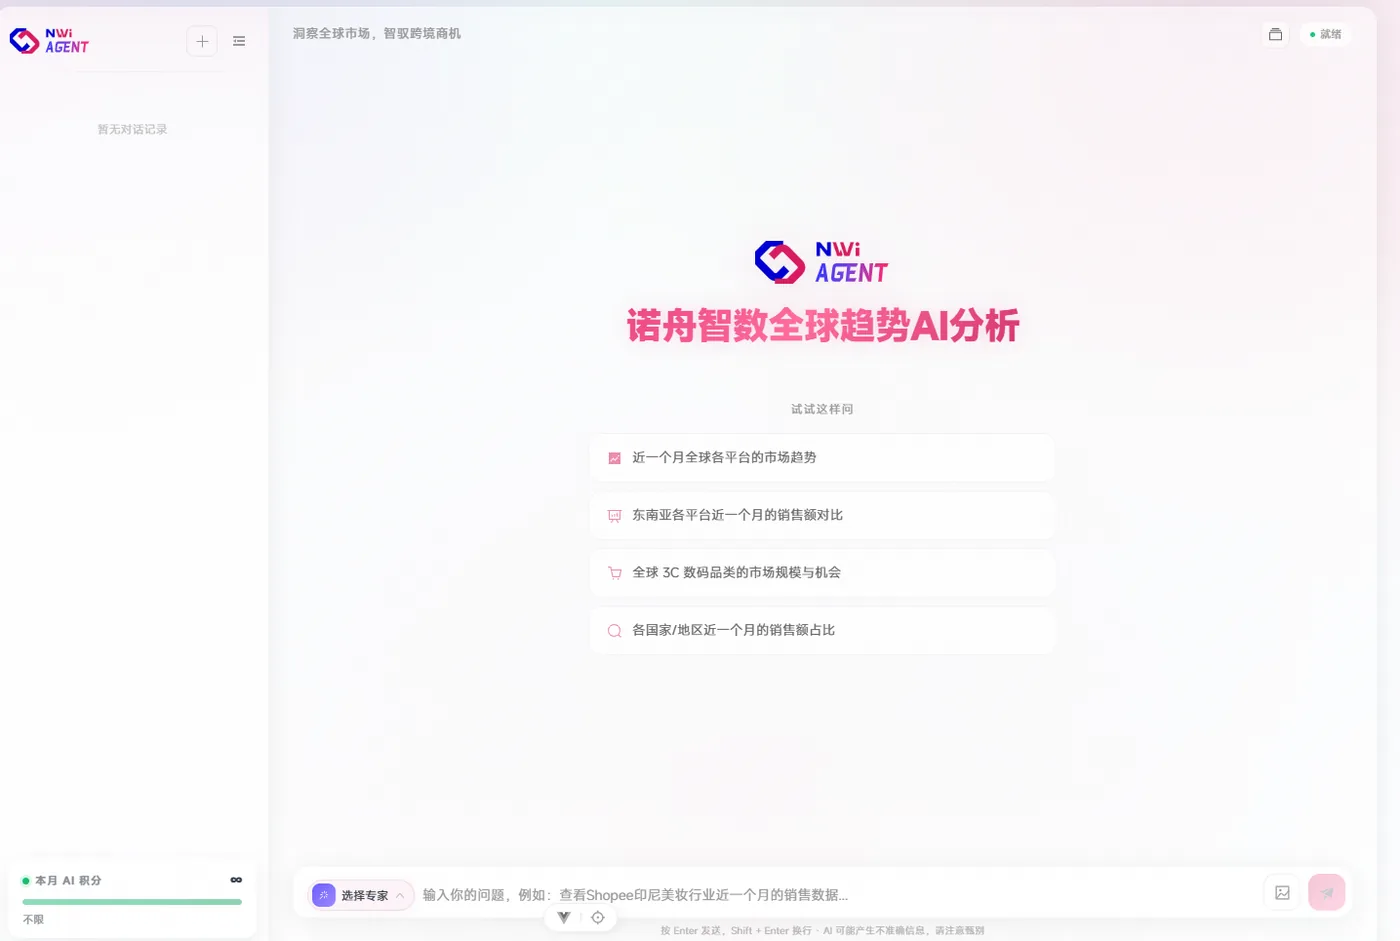
Questions you can answer with it
What are the market trends across global marketplaces over the past month?
Break it down with the same metrics and period instead of looking at a single total.
How do sales compare across Southeast Asian marketplaces over the past month?
Break it down with the same metrics and period instead of looking at a single total.
Where are the scale and opportunities in the global 3C electronics category?
Break it down with the same metrics and period instead of looking at a single total.
What is the sales share by country or region over the past month?
Break it down with the same metrics and period instead of looking at a single total.
How has the leading brand share in this category changed?
Break it down with the same metrics and period instead of looking at a single total.
How to use it
Ask in business language
Ask directly about the category, marketplace, site, time and metrics you care about without configuring a stack of filters first.
Review charts and definitions
AI returns charts, conclusions and data definitions; confirm the statistical period and marketplace scope before judging the conclusion.
Keep asking or export
Continue breaking down categories, price bands and competitors in the same conversation, or use the results in reports.
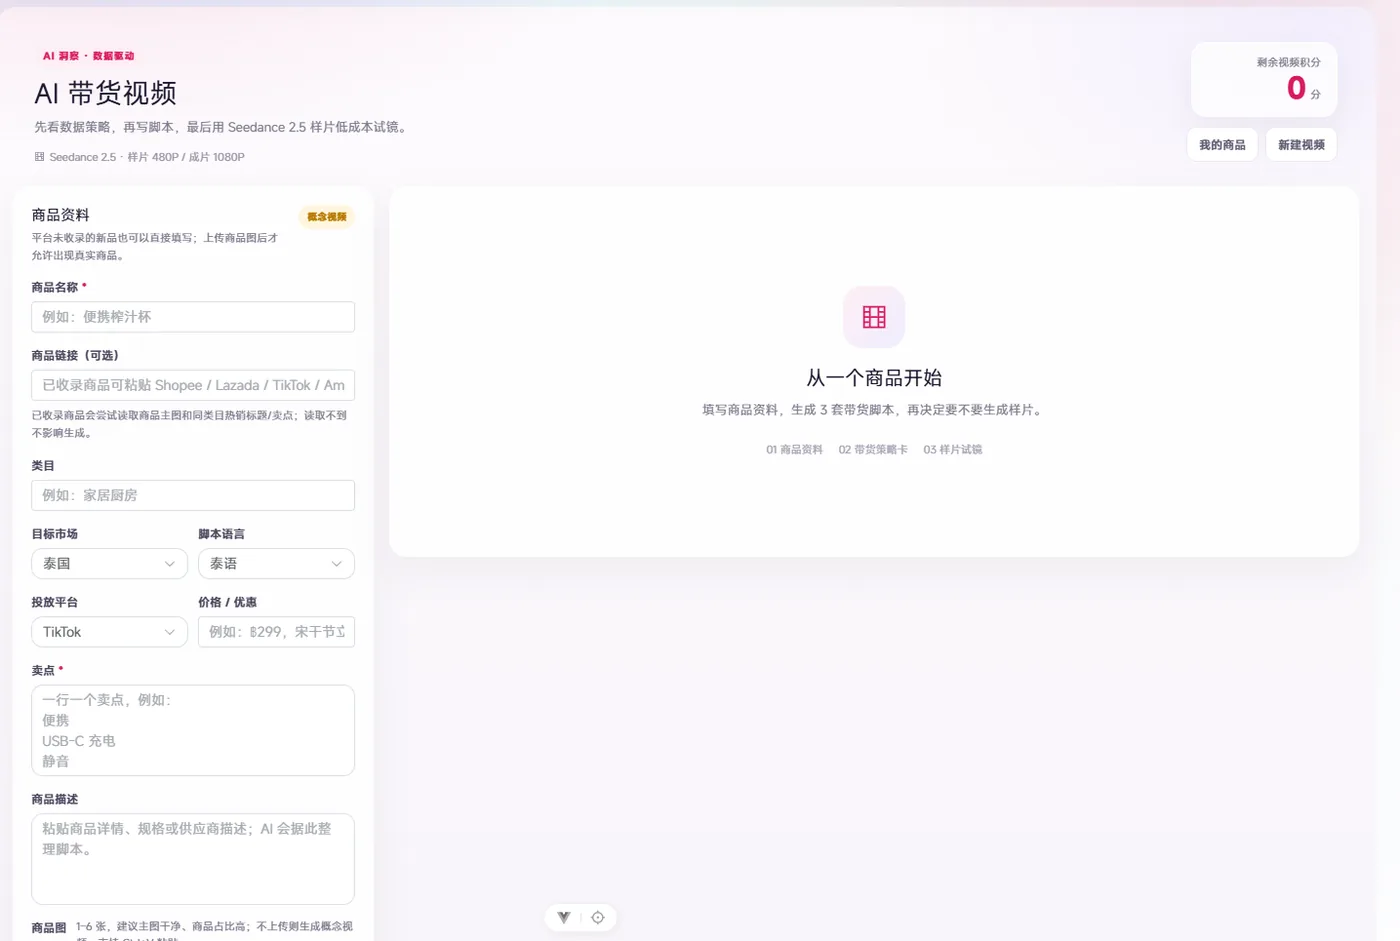
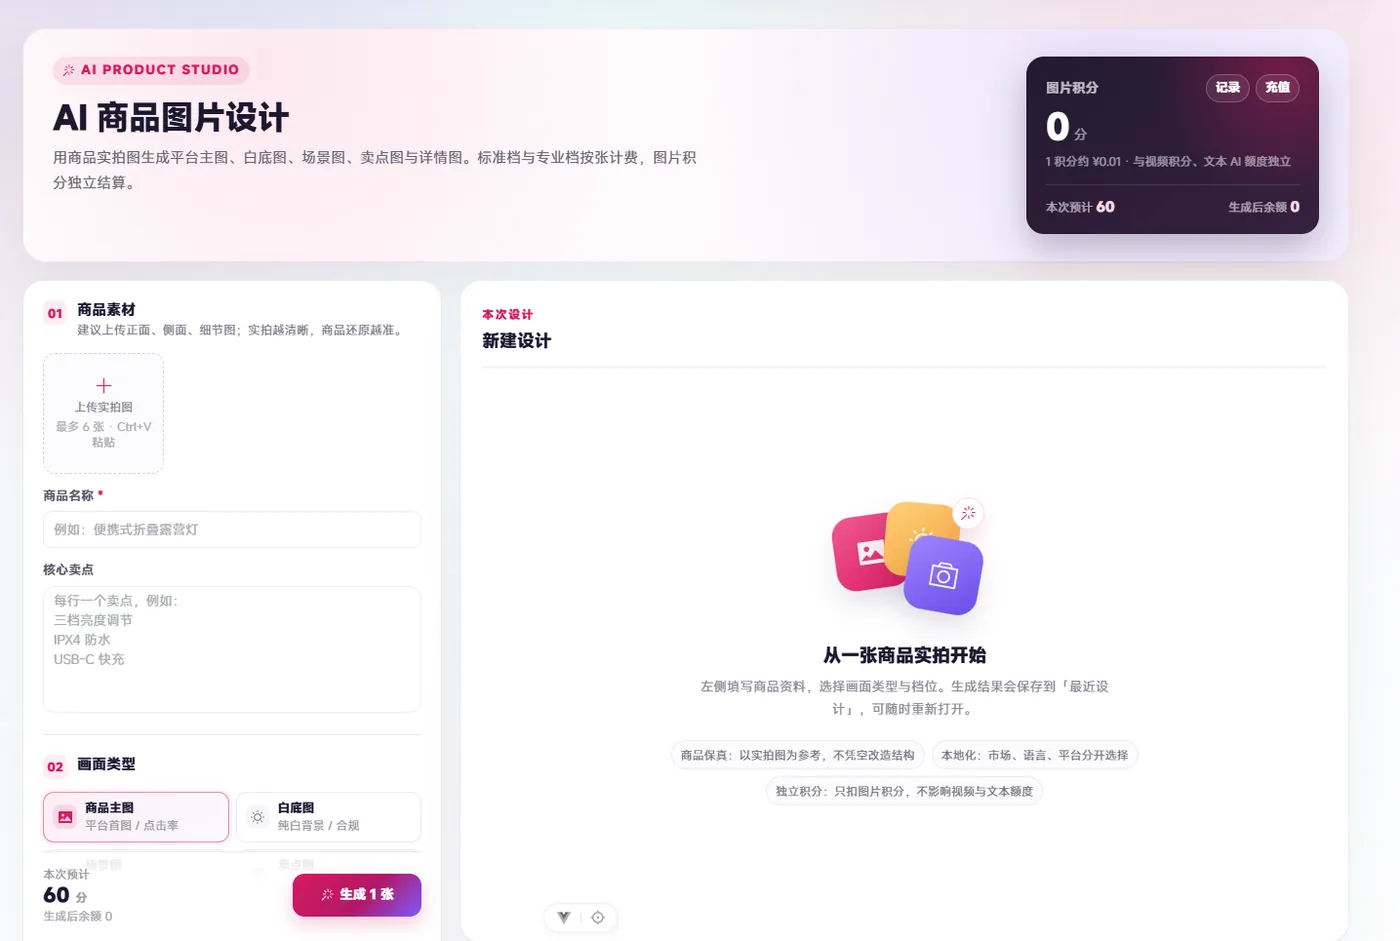
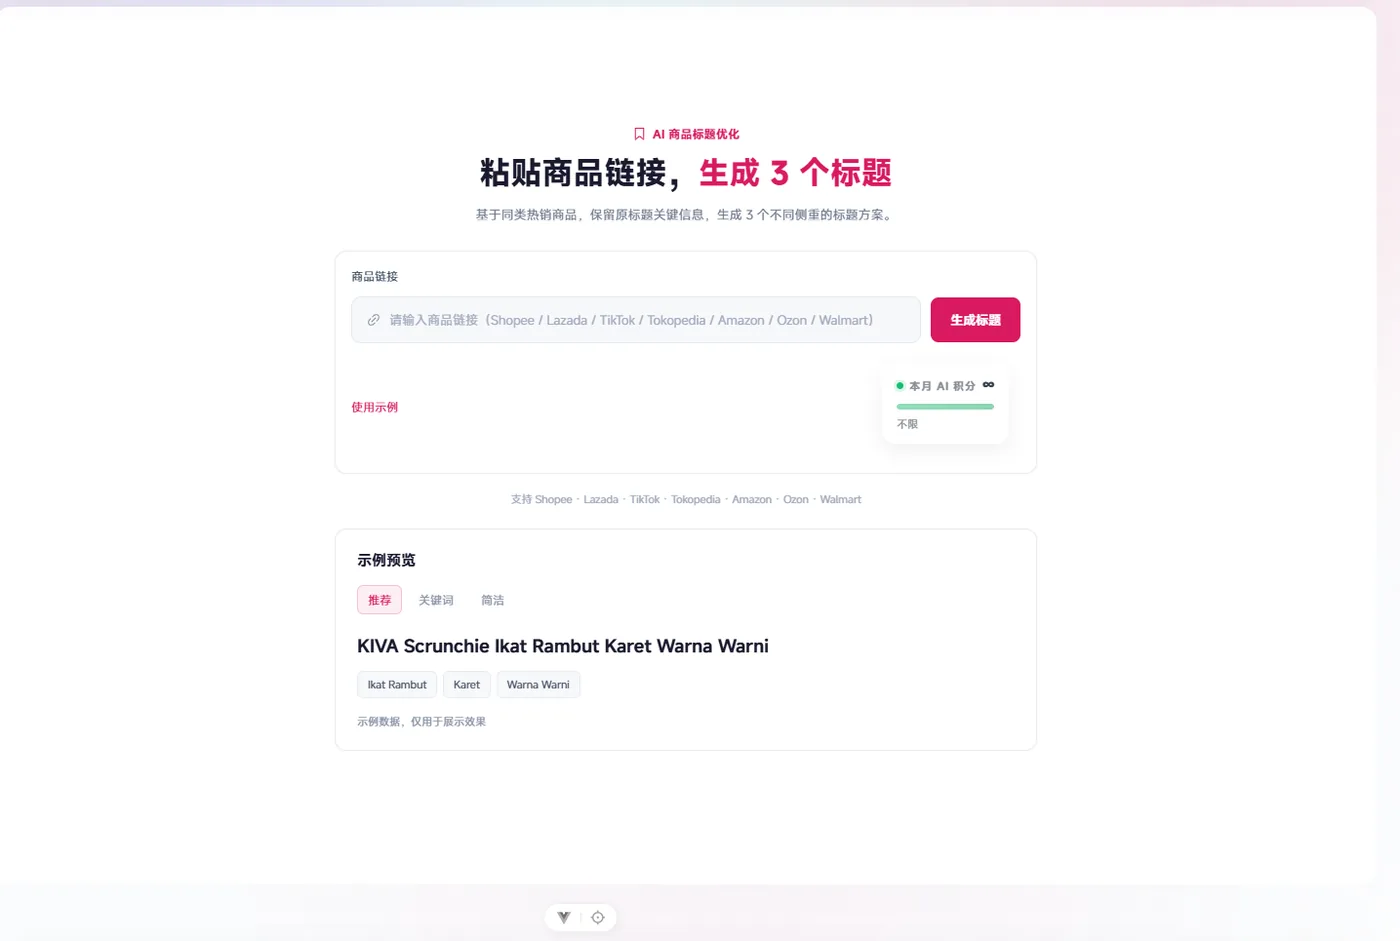
From data queries to content production
Metrics and definitions
| Metric | Definition |
|---|---|
| Sales/units | Market-side estimates aggregated by marketplace and period. |
| Share | Share of sales or units that a marketplace, site or category represents in the total. |
| Growth | Year-over-year or period-over-period; the comparison period must be stated. |
| Brand concentration | Share of category sales held by leading brands. |
Frequently asked questions
What is the difference between AI insight and looking at dashboards directly?
AI insight is suited to fast screening and follow-up questions without configuring filters first; for complex analysis, we still recommend returning to dashboards to verify definitions and details.
Does AI make up data?
AI answers are based on underlying data queries and defined metrics; we label the statistical period and scope in results, and key conclusions should be verified against the charts.
Which marketplaces are supported?
Coverage depends on the data modules you subscribe to; the product currently covers multiple marketplaces, and specific marketplaces and sites are subject to the coverage matrix.
Can I export results into reports?
You can use charts and conclusions in reports; export formats and permissions depend on your plan.
Want to try it with a real category?
We will demo this capability using your marketplace, site and category.
E-commerce data, methods and reports
Explore NWi EC Data product pages, platform coverage, data definitions and published research. Each source states its scope, definitions and limits.