Global overview: see marketplace, site and category market size in one view
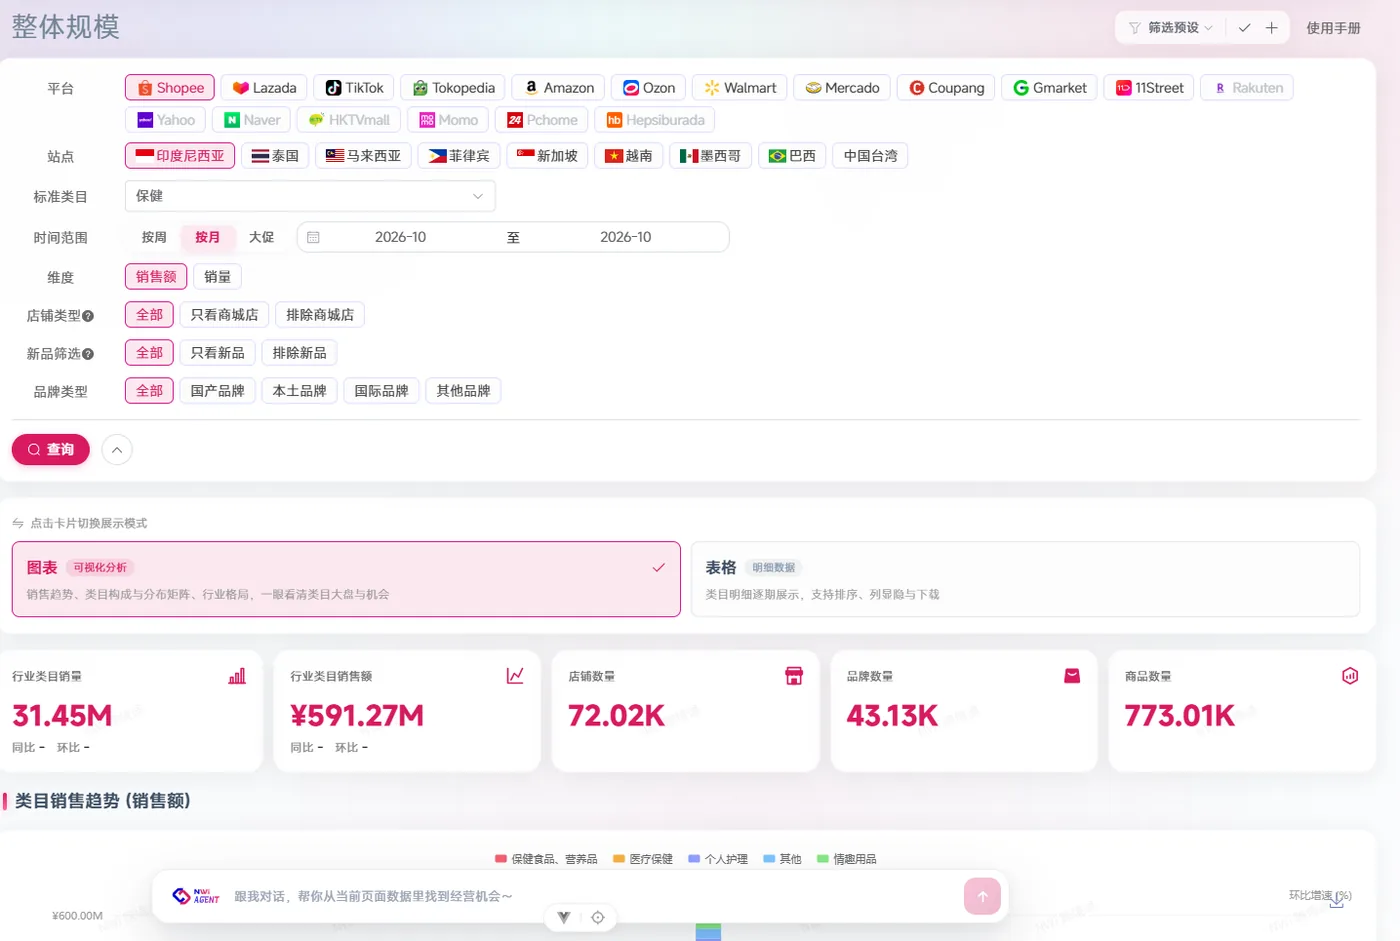
Global overview puts sales, units and category structure across multiple marketplaces and sites on one chart, helping teams first decide which market is worth entering, then which category to examine. NWi CrossborderGo supports switching by marketplace, site, category and time, making it suitable for the first screening layer of market entry.
Questions you can answer with it
Which marketplace or site has the largest category size?
Break it down with the same metrics and period instead of looking at a single total.
How much does growth for the same category differ across sites?
Break it down with the same metrics and period instead of looking at a single total.
Is the market concentrated at the top or fragmented?
Break it down with the same metrics and period instead of looking at a single total.
Which country should I look at first, and which category should I drill into next?
Break it down with the same metrics and period instead of looking at a single total.
Is overall growth driven by a few categories or broad-based?
Break it down with the same metrics and period instead of looking at a single total.
How to use it
Select marketplace and site
First define the marketplaces and countries or regions to compare, so you do not add absolute values from different markets together.
Select category and time
Narrow the scope with level-one and level-two categories, and choose monthly or major promotion windows.
Review size, trend and share
Combine sales, units, growth and category structure to screen markets worth drilling into.
Metrics and definitions
| Metric | Definition |
|---|---|
| Sales | Estimated and aggregated from publicly available item prices and units on each marketplace; not equivalent to marketplace financial statements. |
| Units | Estimated number of items sold during the observation period. |
| Category structure | Share of sales or units by subcategory or price band. |
| Growth | Year-over-year or period-over-period; the comparison period must be stated. |
Related pages
Industry analysis capability
Continue to the next page on this topic.
Open page →Market entry assessment
Continue to the next page on this topic.
Open page →Marketplace and site coverage
Continue to the next page on this topic.
Open page →Pricing and modules
Continue to the next page on this topic.
Open page →Frequently asked questions
What is the difference between global overview and marketplace pages?
Global overview is for first-layer market screening, answering “which marketplace, site or category should I look at first”; marketplace pages drill into a specific marketplace and its items, answering “how do I operate in this category”.
Can I add sales from different marketplaces together directly?
Not recommended. Marketplaces differ in category taxonomy, estimation methodology and coverage, so adding them directly amplifies error; compare trends and structure by marketplace.
How often is the data updated?
Public market data is updated monthly, usually on the 10th to 15th of each month for the previous month.
Can I see historical trends?
Monthly trends are available when time-series fields are included in your subscription; history depth depends on the contract and module.
Want to try it with a real category?
We will demo this capability using your marketplace, site and category.
E-commerce data, methods and reports
Explore NWi EC Data product pages, platform coverage, data definitions and published research. Each source states its scope, definitions and limits.