Cross-border e-commerce product research: validate demand first, then decide how much stock to buy
Product research is not about finding an item that looks like a hit; it is about validating whether demand is stable, whether the price band covers costs, and whether there is still room in the competition. NWi CrossborderGo connects market, category, brand, shop and item data into one product research process, helping teams reduce trial-and-error SKUs.
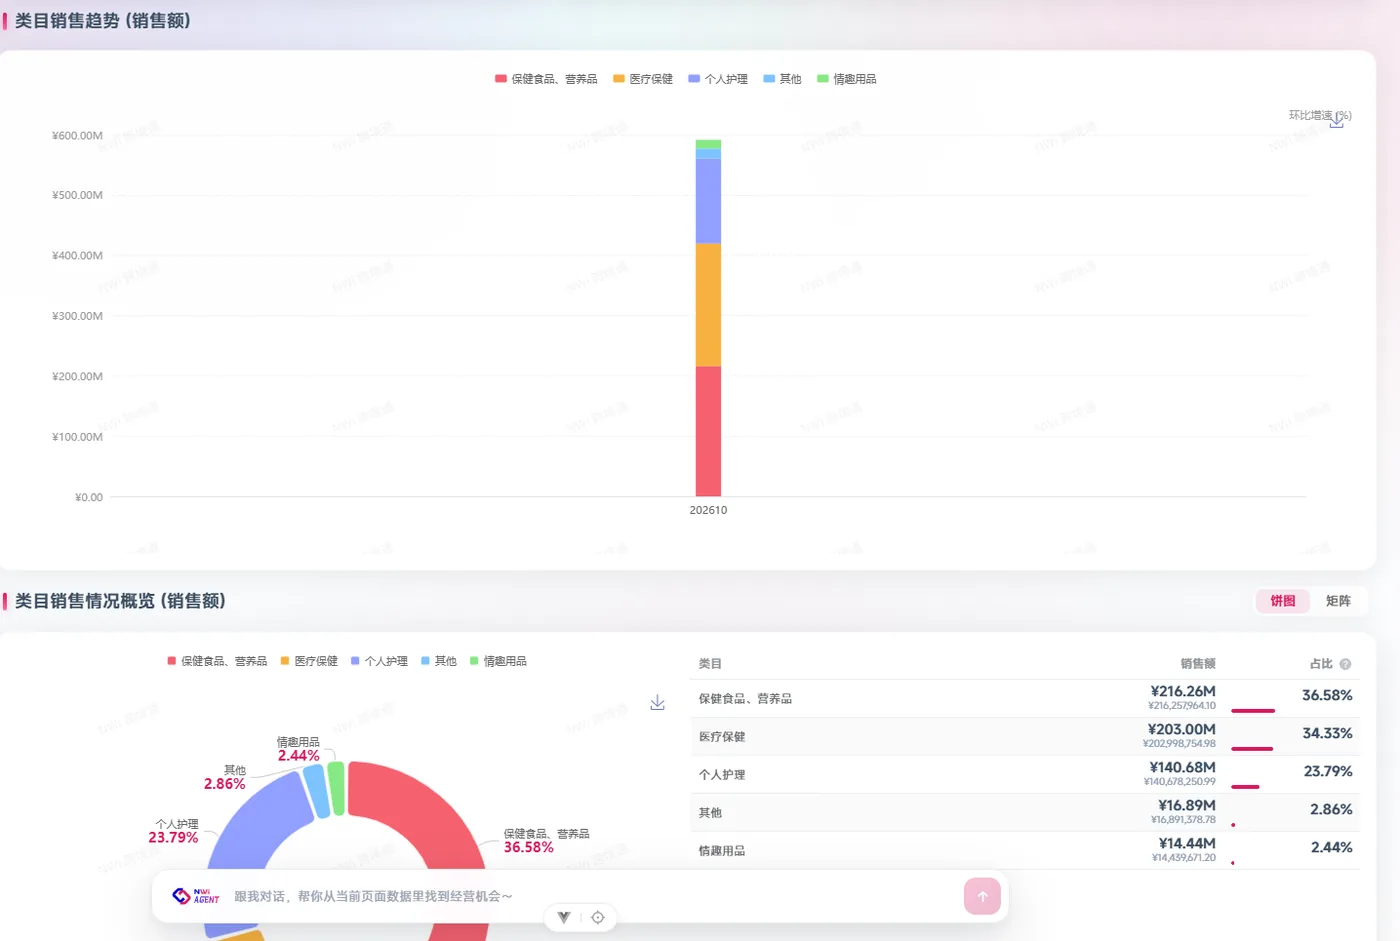
How to do it
Market screening
Start with global overview to see marketplace, site and category size and growth, and rule out markets that look large but are inaccessible.
Category breakdown
Review subcategories, brand concentration, price bands and new product share to find segments with stable demand and unsaturated competition.
Competitor benchmarking
Choose 3–5 direct competitors and break down their product mix, prices, selling points and launch cadence.
Profit modeling
Put marketplace fees, fulfillment, returns and advertising into a unit contribution model to confirm the price band covers costs.
Small-batch validation
Test demand with minimum inventory, then decide whether to scale or stop based on sales and returns.
What you get
Reduce gut-feel product selection
Write conclusions into a recomputable table instead of leaving them in individual experience.
Turn product research conclusions into a recomputable table
Write conclusions into a recomputable table instead of leaving them in individual experience.
Spot price-band and competition problems before stocking
Write conclusions into a recomputable table instead of leaving them in individual experience.
Which metrics to use
| Metric | Definition |
|---|---|
| Market size | Category sales/units, split by marketplace and site. |
| Brand concentration | Share of category sales held by leading brands. |
| Price band share | Share of sales or units by price band. |
| Unit contribution | Per-unit profit after deducting marketplace fees, fulfillment, returns, advertising and other variable costs from the selling price. |
Related pages
Frequently asked questions
Can a product research tool guarantee the right product?
No. Data only reduces the probability of trial and error; it cannot replace supply chain, product differentiation and small-batch validation.
Should I look at the marketplace or the category first?
Look at the market structure of the marketplace or site first, then drill into the category. Locking in a category before looking at marketplaces can easily overlook demand differences across markets.
Is the data enough for profit modeling?
Market data can provide selling price and fee ranges, but procurement, logistics, returns and advertising costs require your own data; combine both to calculate unit contribution.
What size of team is it suitable for?
It suits teams with multi-marketplace or multi-site needs that want to formalize product research; individual small sellers can start with a single-marketplace or single-site module.
Bring your scenario to us
We will use your category and marketplace to demo how far this process can go.
E-commerce data, methods and reports
Explore NWi EC Data product pages, platform coverage, data definitions and published research. Each source states its scope, definitions and limits.