Amazon analytics: see sites, categories, ASINs and competitors clearly
Use Amazon site, category, brand, store and product data to judge demand, price bands and competitive structure.
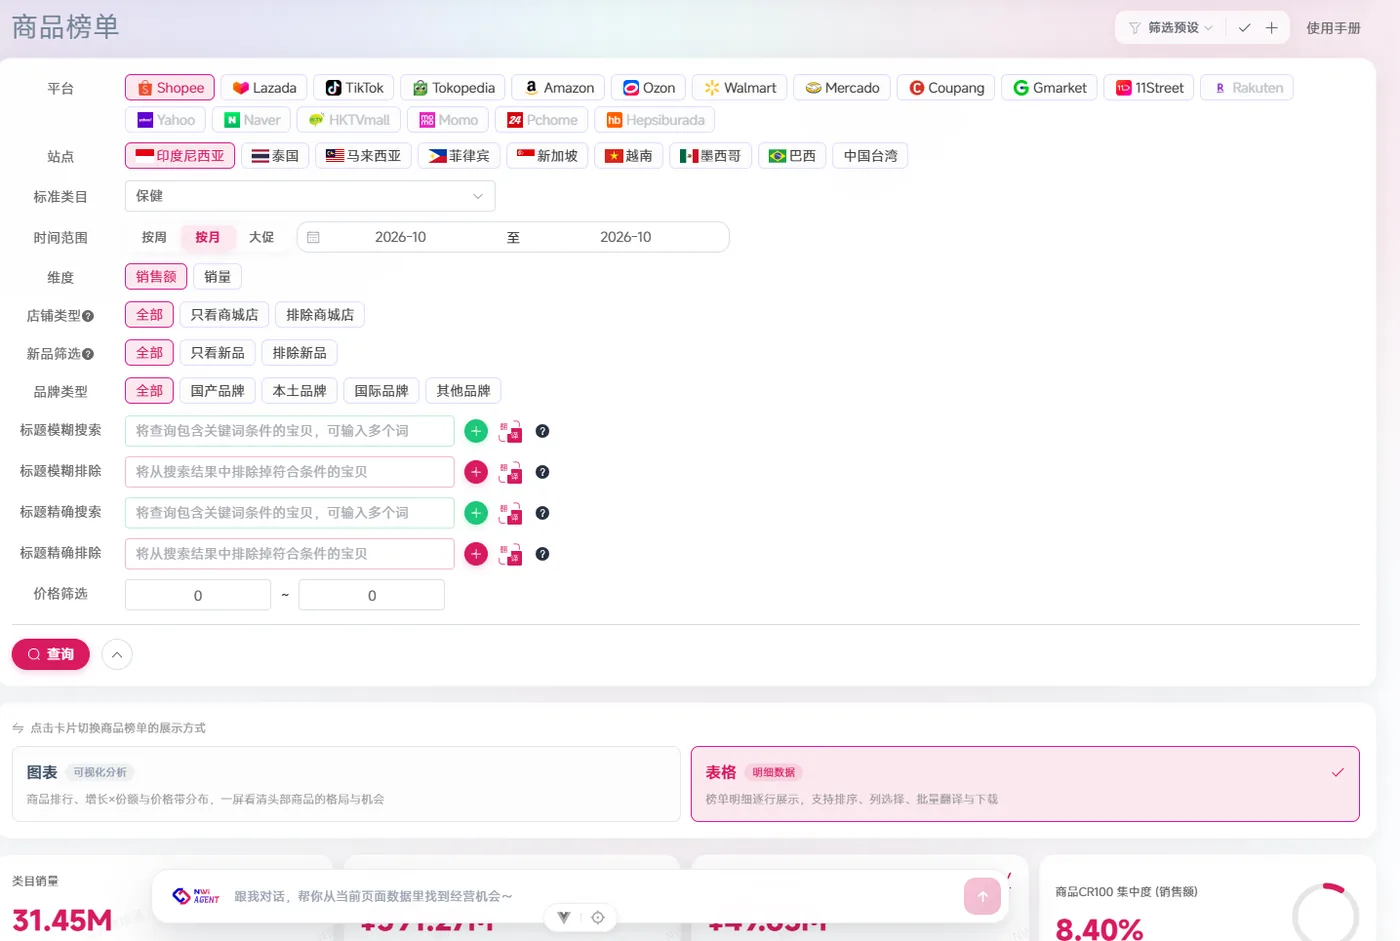
The short answer: Amazon analytics puts site, category, ASIN, price, reviews and advertising into one consistent methodology to judge whether demand is stable, whether competition is concentrated, and whether there is still profit per unit. NWi CrossborderGo puts Amazon sales trends, price bands, brand concentration and competitor moves on one dashboard, which suits teams that need continuous monitoring.
Questions you can answer with it
Between the US and European sites, which category should we tackle first?
Break it down with category, brand, store, product and price band data, and bring the conclusion back to one consistent methodology.
How much share do the leading brands hold, and is there still room for new brands?
Break it down with category, brand, store, product and price band data, and bring the conclusion back to one consistent methodology.
Within the target price band, where are sales concentrated?
Break it down with category, brand, store, product and price band data, and bring the conclusion back to one consistent methodology.
What new products did competitors launch recently, and what prices did they change?
Break it down with category, brand, store, product and price band data, and bring the conclusion back to one consistent methodology.
Is this ASIN's sales trend seasonal or structural?
Break it down with category, brand, store, product and price band data, and bring the conclusion back to one consistent methodology.
Three common workflows
Product selection validation
Look at site and category scale first, then price bands and brand concentration, and finally validate demand with product rankings and reviews/selling points. Every step leaves a recomputable number rather than just a screenshot.
Competitor monitoring
Fix a set of brands, stores and ASINs, and review sales, price, new launches and share changes weekly or monthly. Put competitor moves alongside the category total to judge whether the issue is a single listing or the whole category shifting.
Price band analysis
Segment by average selling price, then compare units, sales and brand count in each price band. Find the interval where "demand exists but competition has not filled it", then return to unit contribution estimates.
Metrics and methodology
| Metric | Definition |
|---|---|
| Sales | Estimated and aggregated from publicly available product prices and units on the marketplace; not the same as marketplace financial statements or seller-center GMV. |
| Units | Estimated units sold during the observation period; estimation error varies by site, category and product type. |
| Average selling price | Sales ÷ units, used to compare price bands; not directly equal to the list price. |
| Brand concentration CR5/CR10/CR20 | The share of category sales held by the top 5/10/20 brands, used to judge whether the top is crowded. |
| Price band share | After grouping products by average selling price, the share of sales or units in each price band. |
| New product share | The share of category sales or product count accounted for by products appearing for the first time during the observation period. |
Coverage
US site · major European sites · Japan site · subject to the actual activation scope of the product
Platforms, sites, historical periods and fields are subject to the coverage matrix confirmed in the contract.
Limits and boundaries
- Public data is estimated and not the same as marketplace transactions; estimates cannot be treated as a financial measure.
- Seller-center orders, advertising, returns and other first-party data require separate integration or import.
- Sites, category levels, historical periods and fields depend on the modules actually activated.
- Deep fields such as reviews, keywords and ad placements are not available in all packages.
Related pages
Platform analytics overview
Continue to the next page on this topic.
Open page →Cross-border e-commerce product selection workflow
Continue to the next page on this topic.
Open page →Competitor monitoring methods
Continue to the next page on this topic.
Open page →NWi CrossborderGo vs. SellerSprite
Continue to the next page on this topic.
Open page →Pricing and modules
Continue to the next page on this topic.
Open page →Amazon analytics FAQs
Which metrics does Amazon analytics show?
You can see market-side metrics such as category and product sales, units, average selling price, brand concentration, price band share and new product share. Seller-center orders, advertising and returns are first-party operating data and require separate integration or import.
Is the data real-time?
Public market data is updated monthly, usually on the 10th–15th of each month for the previous month. If you need higher-frequency competitor or price monitoring, the fields and update frequency must be confirmed in the contract.
Can I monitor competitors by ASIN?
Yes. You can observe a competitor's sales trend, price changes, brand ownership and category position at the product level; the specific historical depth and fields depend on the modules you activate.
Why doesn't the data match my US seller center?
Market data uses an estimation methodology, while the seller center uses a settlement methodology; the statistical scope, return treatment and time slicing differ. We recommend viewing them separately: market data to judge opportunity, seller-center data to calculate profit.
If I only sell on Amazon, is NWi CrossborderGo right for me?
If you only sell on Amazon and mainly need deep keyword, review and advertising data, a single-platform tool may be a better fit. If you sell on multiple marketplaces, or need to place Amazon within an industry and competitor frame of reference, NWi CrossborderGo's multi-platform methodology is more valuable.
Want to see real Amazon data?
Bring your category and target site, and we will walk you through it once.
E-commerce data, methods and reports
Explore NWi EC Data product pages, platform coverage, data definitions and published research. Each source states its scope, definitions and limits.