Shopee analytics: find replicable demand by site and category
Use Shopee site, category, brand, store and product data to judge demand, price bands and competitive structure.
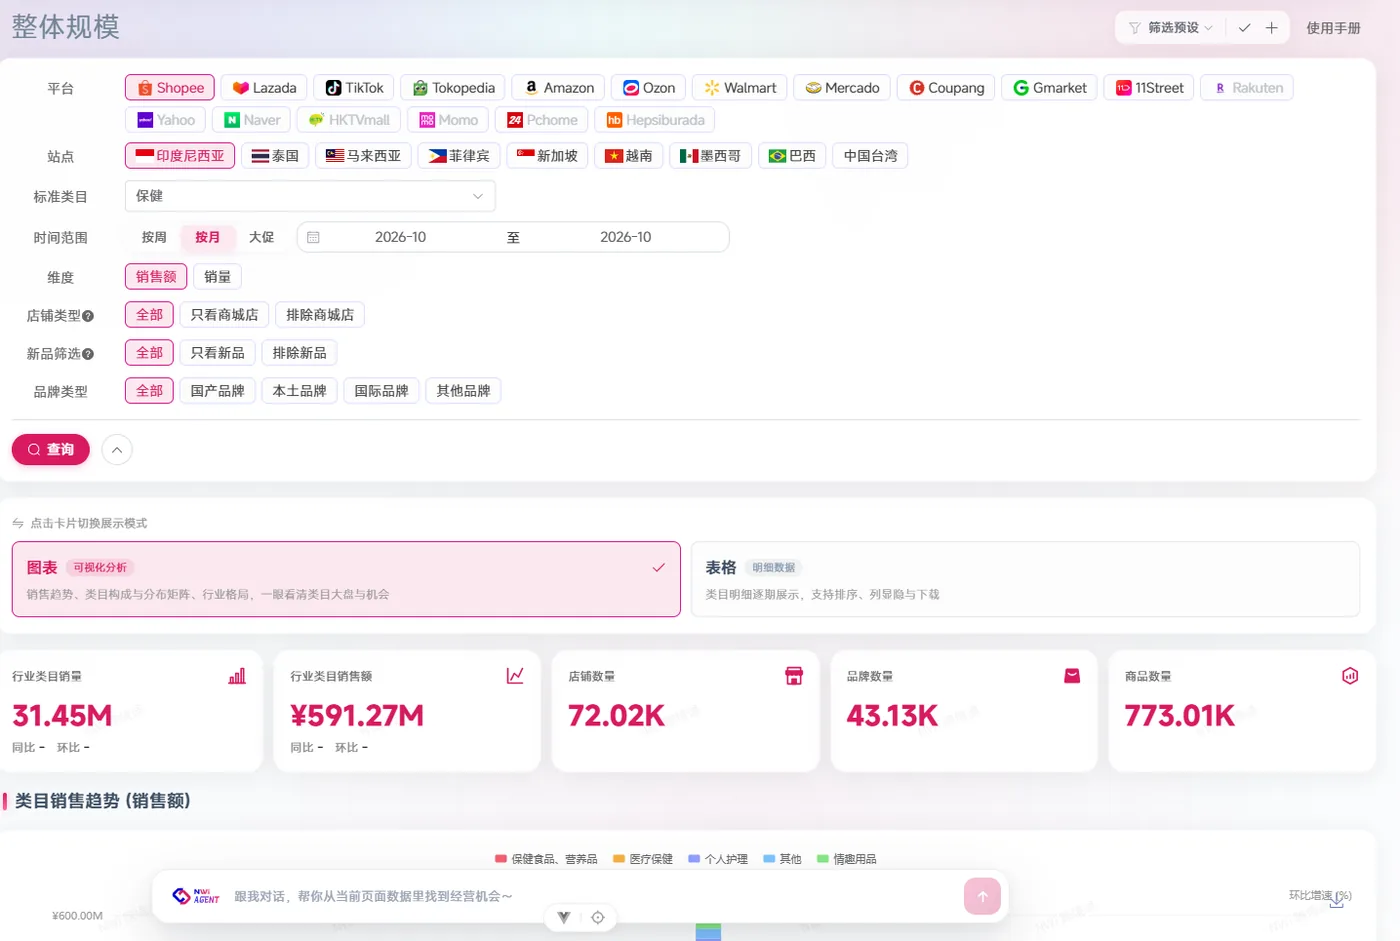
The short answer: Shopee analytics has to be broken out by country site: the same category has completely different demand, price bands and competitive structure in Indonesia, Thailand and Vietnam. NWi CrossborderGo puts category scale, brand/store/product rankings and price bands for each Shopee site into one consistent methodology, helping teams decide which site to enter first.
Questions you can answer with it
Indonesia vs. Thailand: how far apart are the price bands for the same category?
Break it down with category, brand, store, product and price band data, and bring the conclusion back to one consistent methodology.
Who is leading: local brands or international brands?
Break it down with category, brand, store, product and price band data, and bring the conclusion back to one consistent methodology.
After sales spike during a promotion, what level do prices fall back to?
Break it down with category, brand, store, product and price band data, and bring the conclusion back to one consistent methodology.
Which site has a lower CR20, and still has room for new brands?
Break it down with category, brand, store, product and price band data, and bring the conclusion back to one consistent methodology.
Where is the gap between cross-border sellers and local stores?
Break it down with category, brand, store, product and price band data, and bring the conclusion back to one consistent methodology.
Three common workflows
Site comparison
Start by putting the scale, growth, average price and concentration of the same category across multiple sites into one table, to rule out markets that "look big but cannot be entered".
Category selection
Use subcategories and price bands to find intervals with stable demand and unsaturated competition, then return to product rankings for specific selling points and specifications.
Promotion review
Compare units, prices and store rankings during promotion and normal periods to judge whether growth is driven by campaigns or by demand itself.
Metrics and methodology
| Metric | Definition |
|---|---|
| Site sales | Estimated category/product sales aggregated by site; not the same as marketplace financial reports. |
| Units and average price | Units are estimated pieces; average price is sales ÷ units. |
| Brand concentration | The share of category sales held by leading brands. |
| Store concentration | The share of category sales held by leading stores, used to judge operating thresholds. |
| Promotion-period change | Changes in units, prices and rankings between windows such as major promotions/paydays and normal periods. |
| Cross-border/local share | Share of sales by store type or product origin, to be used within the scope of the activated fields. |
Coverage
Indonesia · Thailand · Malaysia · Philippines · Singapore · Vietnam · Taiwan · Brazil · subject to the actual activation scope of the product
Platforms, sites, historical periods and fields are subject to the coverage matrix confirmed in the contract.
Limits and boundaries
- Category systems, currencies and promotion rhythms differ by site, so they cannot be added directly across sites.
- Market data is estimated; platform back-end orders and advertising data must be integrated separately.
- Sites, category levels and historical periods depend on the activated modules.
- Promotion and logistics costs must be calculated together with your own operating data.
Related pages
Platform analytics overview
Continue to the next page on this topic.
Open page →Market entry assessment
Continue to the next page on this topic.
Open page →Cross-border e-commerce product selection workflow
Continue to the next page on this topic.
Open page →Pricing and modules
Continue to the next page on this topic.
Open page →Shopee analytics FAQs
Which sites does Shopee analytics cover?
The product back end shows site options including Indonesia, Thailand, Malaysia, Philippines, Singapore, Vietnam, Taiwan and Brazil; the commercially available scope depends on the modules you activate.
Can I compare the same category across sites?
Yes. Looking at the same category's sales, units, average price, brand concentration and price bands across sites is more decision-useful than looking only at the total for a single site.
Can the data distinguish cross-border stores from local stores?
Where the corresponding fields are activated, you can observe by store type; identifiers and coverage may differ by site and should be stated in the report.
How should promotion-period data be compared with normal data?
We recommend looking at units, prices and rankings in both promotion and normal periods, to avoid mistaking campaign-driven volume for structural growth.
Is it suitable if I only sell on Shopee?
Yes, especially for teams that need multi-site comparison. If you operate only one site and have a limited budget, you can start with a single-site module to validate.
Want to see real Shopee data?
Bring your category and target site, and we will walk you through it once.
E-commerce data, methods and reports
Explore NWi EC Data product pages, platform coverage, data definitions and published research. Each source states its scope, definitions and limits.