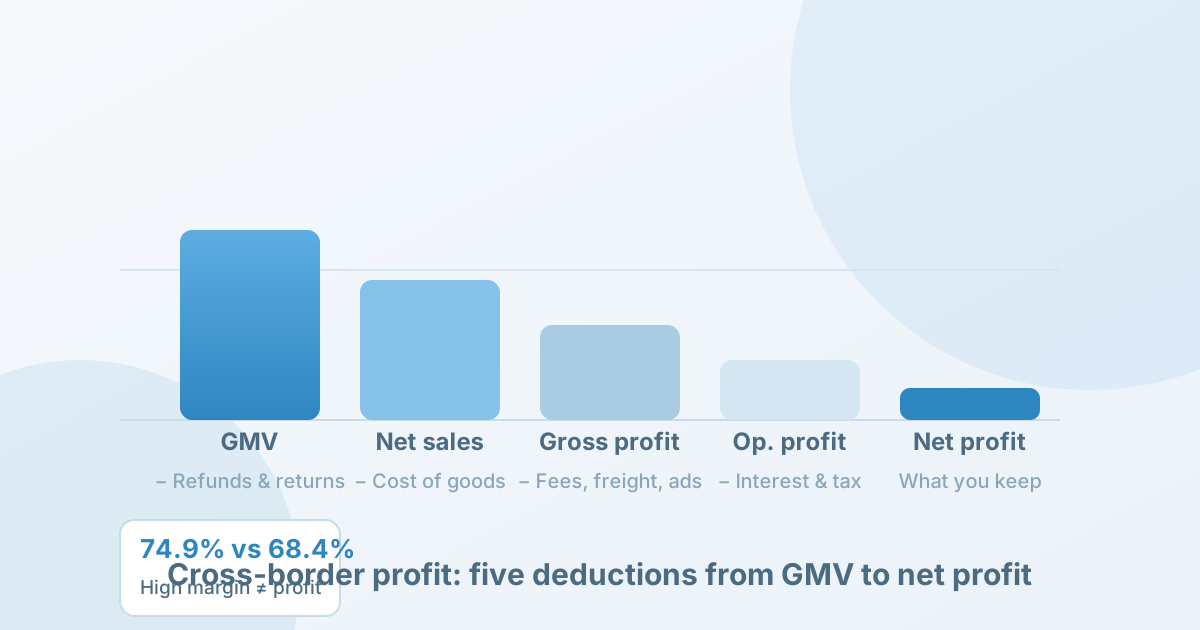
For cross-border sellers already operating on Amazon, Shopee and similar platforms, the real question is how to convert the GMV or order value in a platform report into unit and store net profit after purchase cost, platform commission, fulfilment, advertising, returns and taxes, and then decide whether to raise prices, cut SKUs or fill data gaps. The answer is not to multiply GMV by a fixed margin, but to subtract layer by layer through GMV → net sales → gross profit → operating profit → net profit; purchase cost must be included, and refunds and returns must not be deducted twice.
1. The five layers of net profit: GMV, net sales, gross profit, operating profit and net profit
The mechanism of this subtraction is that each layer removes one class of cost to move closer to the money the seller actually keeps. GMV to net sales removes refunds and returns that were never really received; net sales to gross profit removes the cost of the goods sold; gross profit to operating profit removes the operating expenses incurred in selling, which are not part of the purchase cost. Skip a layer, or treat gross profit as net profit, and you overstate what you keep.
- GMV (gross merchandise value): the total value of all completed orders on the platform in a period, including orders later cancelled, refunded or returned, with no fees deducted
- Net sales (net revenue): GMV minus refunds, return reversals and discounts — what the seller actually receives
- Gross profit: net sales minus the cost of goods sold (COGS, including purchase cost and first-leg freight)
- Operating profit: gross profit minus period expenses such as commission, fulfilment, advertising and storage
- Net profit: operating profit minus interest, taxes and non-operating items
The most common definitional switch in platform reports is to treat quarterly revenue per customer as average order value, or to use it to infer repeat purchase rates. Average order value is net sales divided by the number of orders; revenue per customer is net sales divided by the number of customers, and the two differ by the average number of orders per person. High revenue per customer may mean a high order value, or the same customers ordering repeatedly. Without order counts and customer counts, you cannot claim either a high order value or high repeat purchase.
2. The subtraction structure: what each step deducts, following the IRS Schedule C
The US Internal Revenue Service (IRS) “Publication 334, Tax Guide for Small Business” uses Schedule C (Form 1040) to set out a sole proprietor’s profit as a fixed sequence of subtractions, and that structure maps directly onto cross-border profit accounting: the first line is gross receipts or sales, the second is returns and allowances, subtracting the two gives the net figure, subtracting cost of goods sold gives gross profit, and Part II then deducts advertising, commissions and fees, storage and other period expenses item by item to reach net profit or loss.
Cost of goods sold (COGS) is not just the purchase price. Lines 35–42 of Schedule C define COGS as beginning inventory + purchases (less items withdrawn for personal use) + labour + materials and supplies + other costs (including packaging, freight-in and overhead) − ending inventory. For cross-border sellers, freight-in (first-leg logistics) and packaging must be included in COGS rather than deferred to period expenses, or gross profit will be overstated.
Note that this is a definition under the US federal tax system; cross-border sellers should follow the tax law of their registered entity and destination market. It is cited here for its authoritative subtraction structure and COGS composition, not to apply US tax rates to every seller.
3. The cost layers on cross-border platforms: Amazon and Shopee commission, fulfilment and subscription fees
Platform commission and fulfilment fees are the main sources of period expenses in the net profit subtraction. On Amazon’s US marketplace, for example, the official pricing page shows commission charged by category, paid per item sold as a percentage of the total price or a minimum amount, whichever is higher: beauty, health and personal care is 8% below USD 10 and 15% above, computers is 8%, and most categories have a minimum commission of USD 0.30; the total price includes the list price, shipping and gift-wrap charges.
Sellers also choose a selling plan: USD 0.99 per item on the individual plan, or USD 39.99 a month on the professional plan. Both are period expenses that scale with units or with time rather than with the value of the goods, yet they eat directly into the profit on low-priced items.
Southeast Asian platforms have a similar structure but different bases. Shopee Singapore’s seller fee page shows commission charged as a percentage of the sale price (after seller-sponsored discounts), varying by category and marketplace; new sellers pay 0% base commission for the first 120 days, then the category standard rate. That means the commission base, the cap and the exemption period all differ by country, category and seller status (local or cross-border, Mall or non-Mall), and one marketplace’s rates cannot be applied unconditionally to another.
4. A recomputable example: unit profit and sensitivity in two scenarios
All operating inputs below are hypothetical examples in US dollars; they are not any platform’s average, a recommended price or a real merchant’s result. The denominator is a batch of settled orders that were ultimately not returned; revenue P is the unit revenue for the retained item after discounts and after cancellations and refunds; refunds are already excluded from revenue, and the additional return loss covers only the unrecoverable goods value, reverse freight and non-refundable fees not already counted elsewhere.
Unit operating profit = net sales − COGS − commission − fulfilment − advertising − additional return loss − other period expenses, where COGS = purchase cost + first-leg logistics per unit, and net sales = sale price − refund and return reversals. This only goes as far as operating profit (before interest and taxes); true net profit subtracts those two as well. Every percentage below is operating profit as a share of net sales, not a post-tax net margin.
Scenario A: high ticket, low returns (hypothetical example)
Assume a sale price of USD 35.00, a 5% return rate (USD 1.75 of refund reversal, net sales of USD 33.25), purchase cost of USD 9.00, first-leg freight of USD 1.50 per unit, 15% commission (USD 5.25), FBA fulfilment of USD 6.60, advertising at 8% of the sale price (USD 2.80), additional return loss of USD 0.45 and other period expenses of USD 0.60.
COGS = 9.00 + 1.50 = USD 10.50; gross profit = 33.25 − 10.50 = USD 22.75 (a 68.4% gross margin); unit operating profit = 22.75 − 5.25 − 6.60 − 2.80 − 0.45 − 0.60 = USD 7.05, a 21.2% operating margin.
Scenario A shows unit operating profit of USD 7.05 and a 21.2% operating margin, positive under the assumed inputs; before entering, still replace these assumptions with your own real rates and return data and check again.
Scenario B: low ticket, high returns (hypothetical example)
Assume a sale price of USD 15.00, a 15% return rate (USD 2.25 of refund reversal, net sales of USD 12.75), purchase cost of USD 2.80, first-leg freight of USD 0.40, 15% commission (USD 2.25), FBA fulfilment of USD 4.30, advertising at 20% of the sale price (USD 3.00), additional return loss of USD 1.50 and other period expenses of USD 0.40.
COGS = 2.80 + 0.40 = USD 3.20; gross profit = 12.75 − 3.20 = USD 9.55 (a 74.9% gross margin); unit operating profit = 9.55 − 2.25 − 4.30 − 3.00 − 1.50 − 0.40 = −USD 1.90, an operating margin of −14.9%.
Scenario B has a higher gross margin yet loses USD 1.90 per unit, which shows that fulfilment, advertising and return costs take too large a share on low-ticket items; check the FBA size tier, ad bids and return reasons instead of scaling up at the same price.
The comparison between the two scenarios reveals a counter-intuitive conclusion: Scenario B’s 74.9% gross margin is higher than Scenario A’s 68.4%, yet it loses USD 1.90 per unit. The reason is that fulfilment, advertising and return losses on low-ticket items are costs that are close to fixed or rise linearly with units, so they take a far larger share of the sale price than on high-ticket items. Watching gross margin alone misses these period expenses; net profit is what decides whether you can keep selling.
Sensitivity: Scenario B’s break-even advertising spend is 12.75 − 3.20 − 2.25 − 4.30 − 1.50 − 0.40 = USD 1.10, about 7.3% of the sale price, and advertising above that level turns the unit negative. In Scenario A, if the return rate rises from 5% to 10% (USD 3.50 of refund reversal and USD 0.90 of additional return loss), net sales fall to USD 31.50 and unit operating profit falls to USD 4.85, still positive; its break-even return rate is about 21%.
5. Definition traps: refunds versus returns, gross margin versus net profit, order value versus revenue per customer
The most common double deduction is to subtract the full refund from GMV at the revenue end to get net sales, then deduct the same refund again at the cost end as a return loss. The correct approach is this: refunds are already deducted in net sales, so the additional return loss counts only three items — unrecoverable goods value, reverse freight and non-refundable fees — and commission refunds are reversed according to the actual invoice. In Scenario B, USD 2.25 is the refund reversal at the revenue end and USD 1.50 is the additional return loss at the cost end; they are different measures and cannot be added together and deducted twice.
Another trap is treating gross profit as net profit. Scenario B has gross profit of USD 9.55 and a 74.9% gross margin, yet after fulfilment, advertising and returns it loses USD 1.90 per unit. Gross margin, operating margin, net margin and EBITDA are different measures: gross margin does not reflect period expenses, operating margin does not reflect interest and taxes, EBITDA adds depreciation and amortisation back to operating profit, and adjusted EBITDA also strips out non-recurring items. They cannot substitute for one another.
Definitional switches are just as dangerous: quarterly revenue per customer is not average order value and does not on its own prove a repeat purchase rate. When a platform discloses a metric such as quarterly net revenue per active customer, you cannot conclude that your own order value or repeat rate is high; separating order value, revenue per customer and repeat rate requires going back to the two raw measures, order counts and customer counts.
6. Action plan: what to record, what to use as a baseline, and when to continue or stop
Start by building a record for one SKU grouped by order date that keeps the marketplace, category, list price, discounted sale price, refund and return reversals, purchase cost of goods, first-leg freight and packaging, commission rate and commission, fulfilment fee, advertising spend, unrecoverable return loss, allocated storage and subscription fees, cash set aside for taxes and the actual payout date.
Baseline: recompute unit and store net profit on mature orders from the most recent complete settlement cycle (at least one calendar month, including a full return window) and use that as the comparison. Continue when mature orders, recomputed on actual invoices, show positive net profit that meets your target and returns and payouts have stabilised; adjust when gross profit is positive but net profit is negative, checking fulfilment method, ad bids and return reasons before raising price or changing category; stop when a preset loss budget is reached, net profit stays negative, or you cannot confirm your contracting entity and tax obligations in the target country.
7. Limitations and uncertainty
The unknowns most likely to change the conclusion are the real return rate in the target category, the actual size and weight tier applied to the FBA fulfilment fee, and the tax burden your registered entity should bear. This article only reads the platforms’ public fee pages and IRS publications; it does not enter the seller back office to verify settlement statements. The FBA fees of USD 6.60 and USD 4.30, the advertising percentages and the additional return loss are all assumptions; the seller’s own invoices govern.
This article discusses a profit accounting method that applies across platforms; it does not mean that Nuozhou Digital Intelligence provides real-time sales or commercial data coverage for any particular platform. Fees and taxes must be defined by country, seller entity and contracting model.
Method and notes
Data definitions in this article: commission and subscription fees come from Amazon’s official pricing page, the COGS and profit subtraction structure comes from the IRS Publication 334, and commission definitions come from Shopee Singapore’s seller fee page (all accessed 2026-11-18); the article separates platform GMV from seller net sales, gross profit from net profit, and actual own-store invoices from public rate cards. All operating calculations in the text are hypothetical examples.
For the unit contribution model, see “Mercado Libre Data Analysis: Brazil Units Up 45%, Mexico Slowing — How to Choose a First Latin American Marketplace and Price Unit Contribution from Official Data”; for advertising ceilings and return sensitivity, see “Coupang Data Analysis”; for recalculating cost by SKU, see “Amazon FBA Fee Changes for 2027”; for price bands and margin headroom, see “How to Avoid ‘Price Traps’ in Cross-Border Product Selection”.
Sources
- 1. Amazon, “Standard selling fees” (primary source): read the original, accessed 2026-11-18
- 2. U.S. Internal Revenue Service, “Publication 334 (2025), Tax Guide for Small Business” (primary source, annual publication): read the original, accessed 2026-11-18
- 3. Shopee SG Seller Education, “Seller fees” (primary source): read the original, accessed 2026-11-18
This article was prepared with the assistance of an automated research workflow and is based on the public sources listed at the end; it has not been reviewed by a human editor.