For cross-border sellers operating on Shopee in Southeast Asia, the real question is not how much the whole Shopee market grew, but where your shop’s traffic, conversion and orders are stuck in Seller Centre Business Insights, and how much the platform takes out of every order. The answer has two layers: use the Overview, Product, Sales and Traffic modules of Business Insights to locate whether traffic or conversion is the constraint, then use official fee schedules to turn the multiple bases behind commission, transaction fees, service fees and advertising into unit net contribution. Sea’s Q3 2026 results show Shopee core marketplace revenue up 50.6% year over year and ad take rates up more than another 80 basis points, which means the marginal return on buying orders with more advertising is falling, and ad spend must be decided on incremental profit rather than order count.
1. Where Shopee data comes from: Seller Centre Business Insights and Sea’s results
Shopee data analysis sits at two levels with completely different definitions: Seller Centre Business Insights is first-party operating data for your own shop, while Sea Limited’s financial results are market and monetisation data for the platform as a whole. Business Insights organises data into seven modules: Overview, Product, Sales, Services, Traffic, Marketing and Selling Coach. Overview is the key-metrics dashboard, showing sales, orders, conversion rate, visitors and page views against the previous day, with a hover question mark that explains how each metric is calculated.
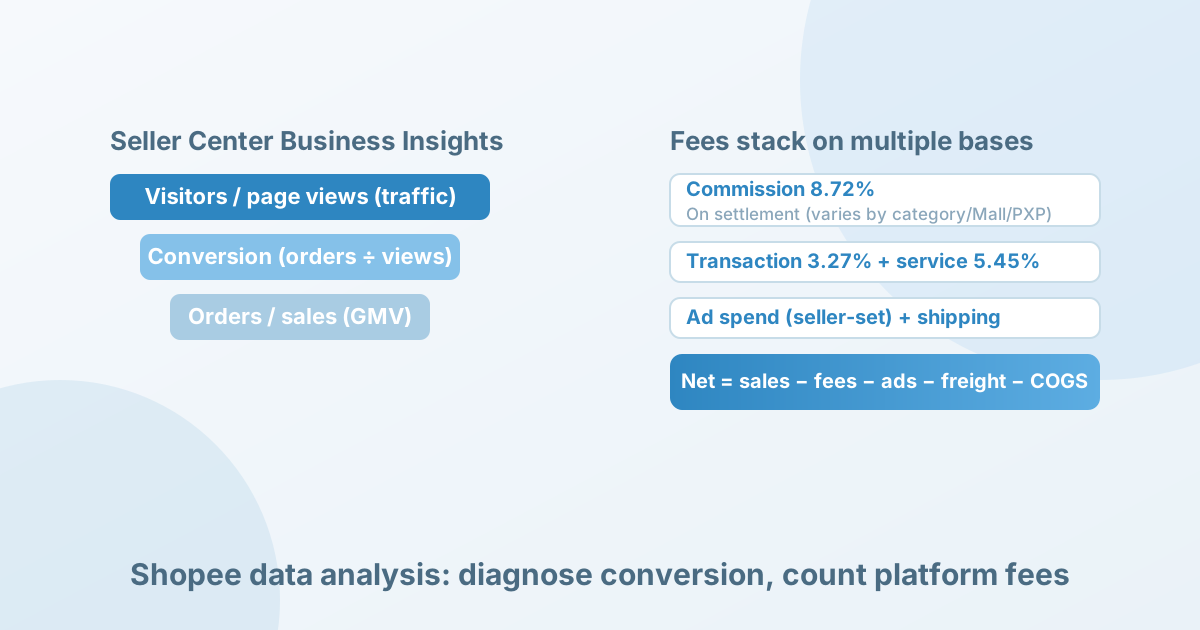
The Overview metrics form a funnel: visitors and page views measure the traffic entry point, conversion rate measures how many visitors become orders, and orders and sales measure final transactions. High traffic with low conversion usually points to listings and price; normal conversion with negative net contribution points to fees and costs.
| Metric | What it measures | How to read it / what it is for |
|---|---|---|
| Visitors | Unique visitors to your shop or product pages | The traffic entry point; tells you whether exposure is sufficient |
| Page views | Total number of times pages are opened | Compare with visitors to read browsing depth |
| Conversion rate | The share of visits that become orders | How efficiently traffic turns into orders; follow the official hover definition |
| Orders / sales | Completed orders and their value | The final scale of transactions |
| Commission / transaction fee / service fee | What the platform takes per order | Deductions in the unit net contribution calculation |
Two definitions need separating: Business Insights reflects only your own shop, not the category or the whole marketplace; Sea’s results reflect the platform as a whole, where GMV is gross merchandise value (including later refunds and returns, with no fees deducted), and platform revenue is not the seller’s money. The two cannot substitute for each other, and platform GMV growth cannot be taken as your own sales growth.
2. How the platform’s cut is calculated: the multiple bases behind commission, transaction fees and service fees
Shopee’s take is not a single rate; it is several rates applied to different bases. Take the Singapore marketplace: new sellers receive a 120-day exemption from the base commission; after that, commission is charged as a share of the sale value after seller-sponsored discounts, varying by category, Mall status and participation in the Promo Xtra Programme (PXP); a transaction fee applies to every successful transaction for all sellers, at 3.27% in Singapore (GST included, and 3.27%–6.54% for SPayLater instalments); and a service fee applies only to sellers in PXP (formerly Coins Cashback). The official fee page lists the current schedule.
The official fee page also shows how the bases diverge: using the example values for one category and seller status on the Singapore marketplace, commission of 8.72%, transaction fee of 3.27% and service fee of 5.45% are all charged on Gross Settlement, meaning the sale value plus platform-sponsored discounts, while advertising and seller shipping follow separate bases. In other words, within a single order different fees sit on different bases, and a simple calculator that multiplies a “single rate” by the list price will get it wrong.
3. A recomputable example: unit net contribution and break-even advertising in two scenarios
The formula and two scenarios below turn fees and advertising into unit net contribution. All operating inputs are hypothetical examples in Singapore dollars (SGD), not platform averages, recommended prices or real merchant results; the commission, transaction and service rates use the official example values above (8.72%, 3.27% and 5.45%), and actual rates vary by category, Mall status and PXP. For simplicity, assume no platform-sponsored discounts, so the settlement base S equals the amount the buyer pays after seller discounts. Unit net contribution = S × (1 − commission rate − transaction fee rate − service fee rate) − advertising − seller shipping − purchase cost of goods (including first-leg freight). This stops at unit net contribution after platform fees, advertising, shipping and goods cost, and does not deduct taxes or other period expenses.
Scenario A: low ticket, paid traffic for volume (hypothetical example)
Assume a transaction value S = SGD 20, participation in PXP (service fee 5.45%), commission 8.72% + transaction fee 3.27% + service fee 5.45% for a combined take rate of 17.44%, and a fee amount of 20 × 17.44% = SGD 3.49; advertising of SGD 4 (20% of the transaction value), seller shipping of SGD 1.5 and purchase cost of goods of SGD 6.
Unit net contribution = 20 − 3.49 − 4 − 1.5 − 6 = SGD 5.01, a net contribution rate of about 25.1%. Break-even advertising = 20 − 3.49 − 1.5 − 6 = SGD 9.01, or about 45% of the transaction value; once advertising goes above that level, the unit turns negative.
Scenario A shows unit net contribution of SGD 5.01 and a net contribution rate of 25.1%, positive but thin under the assumed inputs; keep advertising below the break-even line (about 45% of the transaction value) and fix conversion first rather than adding budget.
Scenario B: high ticket, mostly organic traffic (hypothetical example)
Assume a transaction value S = SGD 60, no PXP participation (service fee 0), commission 8.72% + transaction fee 3.27% for a combined take rate of 11.99%, and a fee amount of 60 × 11.99% = SGD 7.19; advertising of 0, seller shipping of SGD 2 and purchase cost of goods of SGD 18.
Unit net contribution = 60 − 7.19 − 0 − 2 − 18 = SGD 32.81, a net contribution rate of about 54.7%. Compared with Scenario A, the take rate falls from 17.44% to 11.99% because the 5.45% service fee is saved, while the gap in net contribution rate (54.7% against 25.1%) comes more from advertising and quasi-fixed costs (shipping and the proportional fee) taking a larger share of a low ticket.
Scenario B shows unit net contribution of SGD 32.81 and a net contribution rate of 54.7%, clearly thicker under the assumed inputs; protect the organic traffic advantage and put incremental budget into main images, detail pages and ratings rather than spreading ads indiscriminately and diluting margin.
Sensitivity: in Scenario A, if advertising falls from 20% to 10% (SGD 2), unit net contribution = 20 − 3.49 − 2 − 1.5 − 6 = SGD 7.01 (35.1%); if it rises to 30% (SGD 6), net contribution = 20 − 3.49 − 6 − 1.5 − 6 = SGD 3.01 (15.1%). This shows that on a low ticket advertising is the most sensitive lever, while fees and shipping are relatively fixed shares, leaving little room to improve except by cutting advertising or raising price.
4. Turning the reported GMV and rising ad take rate into seller decisions
Sea’s Q3 2026 results (published 2026-11-10) give two data points worth reading together: Shopee core marketplace revenue up 50.6% year over year (made up mainly of transaction-based fees and advertising), while management guides full-year 2026 GMV growth at about 25%; at the same time advertising revenue rose 55% and the ad take rate rose more than another 80 basis points year over year (see the results deck). Core marketplace revenue is growing clearly faster than GMV, which means the platform is taking more money from every unit of GMV — for sellers, the same GMV leaves less after platform fees and advertising.
The mechanism behind this is that Shopee’s monetisation centre of gravity has shifted from value-added logistics services (up 0.1% year over year in the quarter) to transaction fees and advertising. A rising ad take rate may come from higher seller bids, more sellers advertising or new ad products, and Sea’s results do not break down the cause; whatever the cause, it compresses the net return on “buying orders with ads”. The decision variable is therefore not whether to advertise, but whether each additional dollar of ad spend still produces positive incremental net contribution.
One scenario that overturns “rising take rates mean pull back” is this: you have a SKU with stable organic ranking and low ad dependence, so a rising take rate affects you less at the margin than competitors who rely on ads, and it becomes an opportunity to squeeze them out. Another alternative explanation is that a decline in a SKU’s net contribution is not necessarily a platform rate increase; it may be your own ad bids, return rate or purchase cost that changed. The way to tell is to go back to the Seller Centre statements and check commission, transaction fees, service fees and advertising line by line, rather than attributing every margin decline to the platform.
5. Action plan: what to collect, what to use as a baseline, and when to continue or stop
Start by building a record for one SKU grouped by order date that keeps the marketplace, category, transaction value (after seller discounts), commission rate and actual commission, transaction fee, service fee, advertising spend, seller shipping, purchase cost of goods, refund and return reversals and actual payouts.
- Traffic diagnosis: use the Overview in Business Insights to read visitors, page views and conversion rate, and decide first whether the problem is traffic or conversion
- Fee check: against the official fee page, verify the base and rate for commission, transaction fee and service fee order by order, and confirm nothing is over- or under-deducted
- Ad review: decide whether to add budget using “incremental net contribution = incremental transactions from ads × unit net contribution − advertising spend”
Baseline: recompute unit net contribution on mature orders from the most recent complete settlement cycle (at least one calendar month, including a full return window) as the comparison. Continue when mature orders, recomputed on actual statements, show positive unit net contribution that meets your target and incremental ad spend produces positive net contribution; adjust when conversion is low but traffic is high, fixing listings, price and main images first rather than adding ads; stop when advertising approaches the break-even line (about 45% of the transaction value in Scenario A here), unit net contribution stays negative, or you cannot confirm your contracting entity and tax obligations in the country.
6. Limitations and uncertainty
The unknowns most likely to change the conclusion are the real commission rate in the target category, whether you participate in PXP, the real return rate and first-leg cost, and the actual split of transaction fees and advertising within Sea’s “core marketplace revenue”. This article only reads Sea’s quarterly results and Shopee Singapore’s official fee and Seller Centre pages; it does not enter the seller back office to verify settlement statements. The 8.72%, 3.27% and 5.45% figures are official examples or public rates, actual rates vary by marketplace, category and seller status, and every operating number in the text is a hypothetical example.
This article discusses an analytical method built on Shopee’s public data and official fees; it does not mean that Nuozhou Digital Intelligence provides real-time sales, advertising back-end access or commercial data coverage for Shopee. Fees and taxes must be defined by country, seller entity and contracting model.
Method and notes
Data definitions in this article: platform-wide data comes from Sea Limited’s Q3 2026 results release and results deck (both accessed 2026-11-18, primary sources), and Seller Centre metrics and fees come from Shopee Singapore’s Seller Education Hub pages on Business Insights and Seller fees; the 8.72% commission, 3.27% transaction fee and 5.45% service fee are official examples or public rates, and all operating calculations in the text are hypothetical examples.
If you are choosing a first market among the six Southeast Asian marketplaces, see “Southeast Asia E-commerce Review – September 2026: Indonesia Stacks Volume, Vietnam Grabs Growth, Thailand Banks on Ticket Size” and “Going Global in Southeast Asia: How to Choose Your First Market?”; to carry unit net contribution down to net profit, see “Cross-Border Profit Accounting: The Five-Step Subtraction from GMV to Net Profit”; for Thailand’s commission policy, see “Thailand E-commerce Commission Relief”.
Sources
- 1. Sea Limited, “Sea Limited Reports Third Quarter 2026 Results” (primary source, published 2026-11-10): read the original, accessed 2026-11-18
- 2. Sea Limited, “Third Quarter 2026 Results Deck” (primary source, 2026-11-10): read the original, accessed 2026-11-18
- 3. Shopee SG Seller Education Hub, “What is Business Insights” (primary source): read the original, accessed 2026-11-18
- 4. Shopee SG Seller Education Hub, “Seller fees (About Commission, Service, and Transaction Fees)” (primary source): read the original, accessed 2026-11-18
This article was prepared with the assistance of an automated research workflow and is based on the public sources listed at the end; it has not been reviewed by a human editor.