For a brand seller or agency running Amazon Ads in the US store and needing year-over-year comparisons or Black Friday reviews, the question the unified reporting data-availability page updated on 17 November 2026 really has to answer is not 'can I see two years of data', but 'at what granularity and frequency do I export and retain ad data so that nothing is silently lost within a single report'. The answer has three layers: first separate 'historical depth' from 'maximum single pull' — daily history covers 24 months, but a single pull is capped at 120 days; then choose the backfill method using the three columns of granularity, history and single-pull limit; and finally, before the legacy reports page closes on 31 January 2027, turn retention into a fixed routine that protects year-over-year and peak-season reviews through reconciliation rather than ad-hoc pulls.
1. What happened: unified reporting splits historical depth from single-pull limits
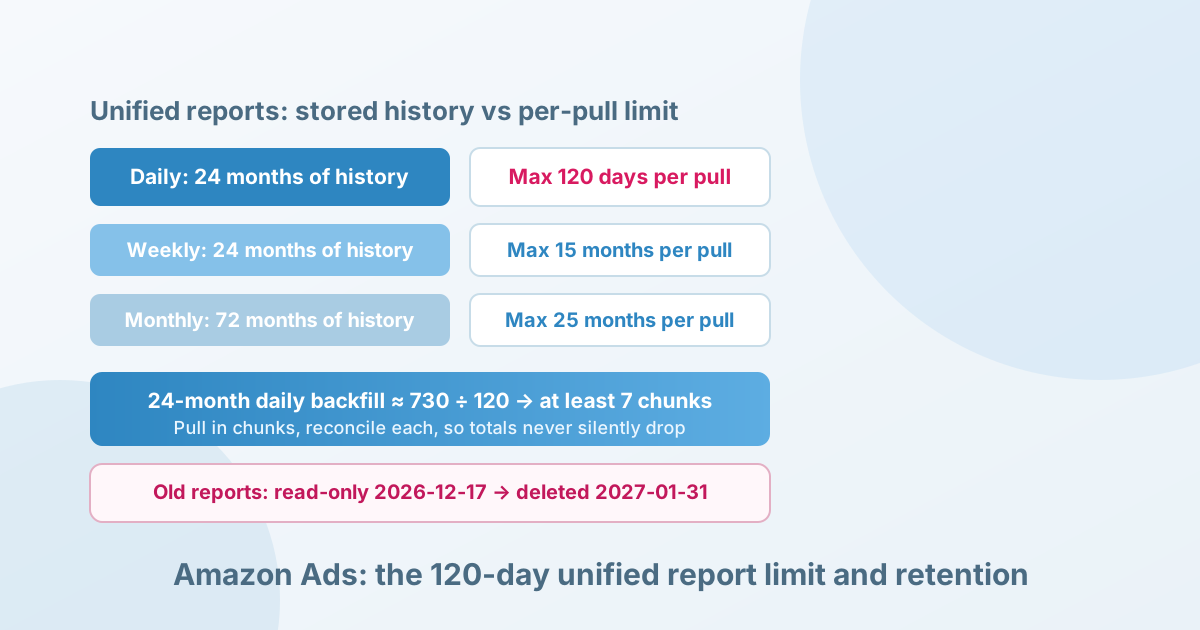
On 17 November 2026, Amazon Ads updated the Support Center's Data availability in unified reporting page, for the first time splitting each time granularity into two columns — Historical data and Max report pull. The two numbers are not the same, and the widest gap is at daily (Date) granularity: 24 months of history but a maximum of 120 days per report; week, day-of-week and day-of-month have 24 months of history and a 15-month single-pull limit; month has 72 months of history and a 25-month limit; hourly has only 14 days of history (Reporting app and Reporting API). PPC Land's report of 18 November 2026 reproduces the same table word for word and notes that the purpose of the two columns is to help advertisers avoid accidentally receiving partial data when choosing a date range.
| Time granularity | Historical depth | Maximum single pull | How to read it |
|---|---|---|---|
| Hourly | 14 days (app/API) | 14 days | Last two weeks only; hourly troubleshooting |
| Daily (Date) | 24 months | 120 days | Long history, short pull; segment and backfill |
| Week / day-of-week / day-of-month | 24 months | 15 months | Two pulls cover 24 months |
| Monthly (Month) | 72 months | 25 months | Three pulls cover six years |
| Year / custom range | 72 months | 72 months | One pull covers it all |
One easily misread point needs separating immediately: the 120 days for daily data is a single-pull cap, not the retention period — historical depth is 24 months. That difference determines that the task is not to download a report quickly, but to segment by window, align the segments, and reconcile once the pulls are done.
2. Mechanism: why a report silently drops data instead of erroring when a single pull cannot cover everything
The page explains that when a report's date range starts before a field's available start date, dimensions and metrics are handled differently: dimensions return null, while metrics return data only for the available window. The key risk is in the totals: a six-month summary that includes a metric which only started midway through the window will not error or warn; it simply returns only the months in which that metric exists, so the total is understated.
Besides the main table, the page lists several fields whose start dates are later than the main window (Reach from 1 July 2024, Total cost/ROAS reconciled from 4 August 2024, Off-Amazon conversions from 27 June 2025, Benchmark group from 1 June 2025, Ad variation fields from 1 October 2026), plus a note on video metrics: for Sponsored Products video, only the 5-second views and 5-second view rate metrics are real data; other video metrics may show 0 as a placeholder, and 0 is not a real measurement. This means that neither blank cells nor zeros in unified reporting can be taken at face value.
3. Evidence boundaries: which numbers can be applied directly and which cannot
The facts that can be quoted directly are only the two sets of numbers in the official table — historical depth and maximum single pull — the start dates of restricted fields, and the video placeholder note, all cross-checked against the Amazon Support Center page and PPC Land's word-for-word reproduction. Three conclusions cannot be drawn: first, the page has no changelog, so it cannot be asserted that the 120-day limit only took effect on 17 November 2026; second, the page does not list markets, so the same terms cannot be assumed for every store; third, the legacy reports page closure dates (read-only from 17 December 2026, closed on 31 January 2027 with unmigrated reports permanently deleted) come from PPC Land's account of Amazon's migration page, and this article could not read the migration page directly, so they are marked as reported by PPC Land rather than confirmed by Amazon.
Three kinds of data also need to be kept apart: your own ad reports are actual delivery data from your account; Amazon Marketing Stream is an account-level data stream pushed to your AWS account; and sales or traffic figures from third-party tools or rankings are model estimates. This article discusses only the pulling and retention of unified reporting (Reporting app, Reporting API, Marketing Stream), not the accuracy of third-party estimation tools.
4. A checkable analysis: how many pulls are needed to backfill 24 months
The backfill counts below are calculated from the official numbers and require no operating assumptions. For daily data over 24 months: 120 days per pull, and 24 months is about 730 days, so 730 ÷ 120 = 6.08, rounded up to 7 segment pulls, which you then stitch together and align at the start and end dates; for weekly data at 15 months per pull, two pulls cover 24 months; for monthly data at 25 months per pull, three pulls cover 72 months. PPC Land calculates the same way — at least 7 pulls for daily, 2 for weekly and 3 for monthly — and notes that a daily year-over-year comparison between November and the previous November cannot fit in a single daily report because the two periods are more than 120 days apart, whereas a weekly report (15 months) can hold both years at once.
One caveat on the definition: 730 days is an approximation of two years; when aligning natural days segment by segment, each 120-day segment is a maximum pull, and reports may have boundary constraints on whether the start and end dates are inclusive and whether exactly 120 days can be selected, so your own account's available date range governs. The backfill count is only an upper-bound estimate of the minimum number of segments, not the export frequency itself.
Scenario A: Single brand on the US store, daily Black Friday year-over-year, 2025 vs 2026 (hypothetical example)
Assume you are a US brand seller using only the unified reporting UI and building no data warehouse, and your goal is to compare daily ad spend and ROAS for November 2025 and November 2026. Because the two periods are more than 120 days apart, a single daily report cannot hold the comparison, so you need to split the 24-month history into at least 7 pulls of 120 days and stitch them into a fact table by date, campaign, ad group and ASIN.
Result: if you pull only once, the totals silently lose data outside the window without any error; after stitching the segments, each export must be reconciled against the platform invoice using total spend to confirm there are no missing or duplicated segments.
Action: verify the monthly/weekly trend first, then backfill 24 months in 120-day segments; build a date, campaign, ad group and ASIN fact table and reconcile each export against the invoice total; write the 120-day single-pull cap into the reporting SLA. This avoids being unable to produce daily data from two years ago when a client asks for it at short notice.
Scenario B: Agency with 10 accounts, mainly weekly/monthly reviews (hypothetical example)
Assume you are an agency whose clients look only at weekly trends and monthly profit, with no daily cross-year attribution. Weekly pulls cover 15 months, so two pulls cover 24 months; monthly pulls cover 25 months, so a single pull covers more than two years of monthly data at lower cost.
Result: with weekly/monthly granularity you do not need to run 7 daily backfills per account, so retention and review costs are materially lower; only anomalous accounts need daily data.
Action: prioritise weekly/monthly granularity and add daily data only for anomalous accounts; write the 120-day limit into the reporting SLA so clients do not ask at short notice for daily data from two years ago; for cross-account consolidated reports, check nulls and placeholder zeros account by account. Do not add one account's placeholder zero to another account's real data.
5. Counter-examples and alternative explanations: when you do not need 7 backfill pulls
One scenario that overturns the need for segmented backfill: if you only need the last 90 days of daily data (inside the 120-day window), or you switch to weekly/monthly reports, the built-in presets are enough and building a data warehouse may not pay off. Another alternative explanation is that an understated total is not necessarily lost data — it may be that you selected a restricted field (such as Off-Amazon conversions) with a range starting before its start date, or that account permissions hide the field. The way to tell the difference is to go back to the report and check the time granularity, field start dates and permissions, rather than attributing every mismatch to a platform cap change.
6. Action plan: what to collect, what to use as a baseline, and when to continue or stop
Break the retention work into three tasks first: list the reports you run regularly with their time granularity and fields; decide the retention cadence for each report (daily in 120-day segments, weekly/monthly as needed); and complete migration or manual rebuilding before legacy reports become read-only on 17 December 2026. According to PPC Land, the legacy reports page becomes read-only on 17 December 2026 and closes on 31 January 2027, permanently deleting saved reports, schedules and historical data that have not been migrated, and the migration tool migrates only active reports from the last 24 months.
- Inventory: list every saved and scheduled report on the legacy reports page, noting its time granularity, fields and whether it is still in use
- Pre-migration check: confirm whether each field in the reports you plan to migrate has an equivalent in unified reporting, and record the fields that will be dropped (for example, keyword-level top-of-search impression share is kept only at campaign level)
- Retention: export daily data in 120-day segments and weekly/monthly data using the 15/25-month windows, reconciling each segment against the invoice total
- Baseline: use the most recent complete peak-season cycle (last Black Friday and Cyber Monday) at daily/weekly granularity as the year-over-year baseline, verifying the trend before backfilling segment by segment
Continue if: after segmented backfill, totals reconcile with the platform invoice, the year-over-year definitions match and the fields are complete. Adjust if: a field's start date is later than your comparison starting point — use the overlapping window after that date for the year-over-year comparison. Stop if: a report cannot be migrated before 31 January 2027 — download the historical data manually for archiving rather than waiting for automatic migration.
7. Limitations and uncertainties
The unknowns most likely to change the conclusion are the official wording on the legacy reports closure date and on which fields are retained during migration (this article did not read the migration page directly), whether the 120-day window is inclusive of start and end dates, and the rate limits and field differences between the Reporting API and Marketing Stream. The page does not list markets or say when these limits took effect, so the 120 days cannot be treated as a single hard constraint for every store and every account worldwide. This article does not imply that Nuozhou Digital Intelligence already provides real-time Amazon Ads data or reporting tools; the final terms for retention and migration are governed by your seller account and Amazon's official notices.
Method and notes
Data basis: historical depth and maximum single pull for each unified reporting granularity, and the start dates of restricted fields, come from Amazon Ads Support Center's Data availability in unified reporting page (updated 17 November 2026); because that page is dynamically rendered, this round cross-checked its page record against PPC Land's word-for-word reproduction of the table. The legacy reports' read-only date of 17 December 2026, closure on 31 January 2027 and migration limits are based on PPC Land's account of Amazon's migration page, and this article did not read the migration page itself. The backfill counts are arithmetic calculations from the official windows and involve no operating assumptions.
The increment in this analysis is that the official matrix of historical depth and maximum single pull is translated into backfill counts, reconciliation steps and two seller/agency scenarios, and that the mechanism of silent data loss is pointed out (understated totals with no error, and placeholder zeros and nulls that cannot be treated as data). That is a decision tool you cannot get from reading news headlines.
To carry ad spend and backfilled data down to net profit, see Cross-Border Profit Accounting: The Five-Step Subtraction from GMV to Net Profit; to understand how the 2027 fee changes on Amazon's US store affect per-unit contribution, see Amazon FBA Fees for 2027; and for a method that links platform data and seller data into a decision chain, see Shopee Data Analysis.
References
- 1. Amazon Ads Support Center, 'Data availability in unified reporting' (primary source, updated 2026-11-17): view original, accessed 2026-11-18
- 2. PPC Land, 'Amazon limits daily unified reports to 120 days of its 24-month history' (published 2026-11-18): view original, accessed 2026-11-18
- 3. PPC Land, 'Amazon advertisers will lose unmigrated reports on January 31, 2027' (published 2026-11-12): view original, accessed 2026-11-18
This article was prepared with the assistance of an automated research workflow and is based on the public sources listed at the end; it has not been reviewed by a human editor.