For a seller about to enter an Amazon category, the question that really needs answering is how many units the category actually sells each month, how much of that the leading competitors take, and where the price band sits — in other words, is it worth stocking, advertising and carrying return risk for it? This article sets out a recomputable way to judge: use the search volume, clicks, add-to-carts, purchases and competitive shares from Amazon's official tools to build the category's monthly units and monthly GMV bottom-up into a range, then compare it with your own sales target to decide whether to enter, place a small trial order or walk away. Every number here is an explicitly labelled illustrative example, not a platform average or real shop data.
1. First get the definitions right: Amazon's official data gives you funnel shares, not competitor sales
Amazon's official seller tool Product Opportunity Explorer (POE, retrieved on 2026-11-19) groups products into 'niches' — sets of search terms grouped by the products shoppers view or buy after searching. Its public page says it provides four types of data: demand and purchase behaviour, competition and saturation, search terms and search volume, and customer reviews and return activity, and it separately flags 'unmet demand' — search-term groups whose conversion rate is below the benchmark — to represent high-demand, low-competition opportunities.
- Where POE lives: Seller Central main menu → Growth → Product Opportunity Explorer
- Core definition: a niche is a group of search terms, not a single ASIN of yours; 'unmet demand' means search-term groups converting below the benchmark
- Amazon states explicitly that the tool only supports judgement and does not guarantee any sales or results (wording from the public page's FAQ)
Likewise, Amazon's Brand Analytics public page lists four dashboard groups: Search Analytics (Search Catalog Performance, Search Query Performance, Top Search Terms), Consumer Behavior Analytics (Repeat Purchase Behavior, Demographics, Market Basket Analysis), Customer Journey Analytics and Customer Loyalty Analytics. Search Query Performance gives query volume, impressions, clicks, cart adds and purchases — the funnel showing which keywords find your own brand and how those shoppers click, add to cart and order; Top Search Terms gives sitewide search terms and, for each, the Top 3 products, categories and brands.
The eligibility threshold also needs checking first: the Brand Analytics public page requires a Professional selling plan ($39.99 a month plus referral fees), Brand Registry enrolment and a Brand Representative role, with the entry at Seller Central main menu → Brands → Brand Analytics. This follows the US sell.amazon.com pages; availability and interface names on other marketplaces may differ and the seller centre should prevail. Amazon's page also says new products launched using POE insights have 2.5 times higher sales potential in their first three months, with a footnote noting this is 2025 Amazon internal data from sellers in the US, EU and Japan — Amazon's own internal measure, not independent verification.
2. Bottom-up: turning 'search volume' into 'category monthly units and monthly GMV'
Search exposure has to pass through several conversion layers — click into the detail page, add to cart, order — before it becomes a sale, and each layer's share decays, so looking at search volume alone overstates capacity; clicks, conversion and average order value together determine how many units and how much money the category can sell. Since the official data gives search volume, clicks, conversion and shares, category capacity has to be derived bottom-up, with each input taken from the official tools and its definition checked.
| Metric | Definition / where it comes from | This example (illustrative) |
|---|---|---|
| Monthly search volume S | Monthly search volume for the niche's keywords in POE / Brand Analytics | 120,000 |
| Click-through rate CTR | Share of searches that lead to a detail page visit | 40% |
| Conversion rate CVR | Share of detail-page visits that end in an order | 10% |
| Average order value AOV | Average selling price for the niche (midpoint of the price band) | $25 |
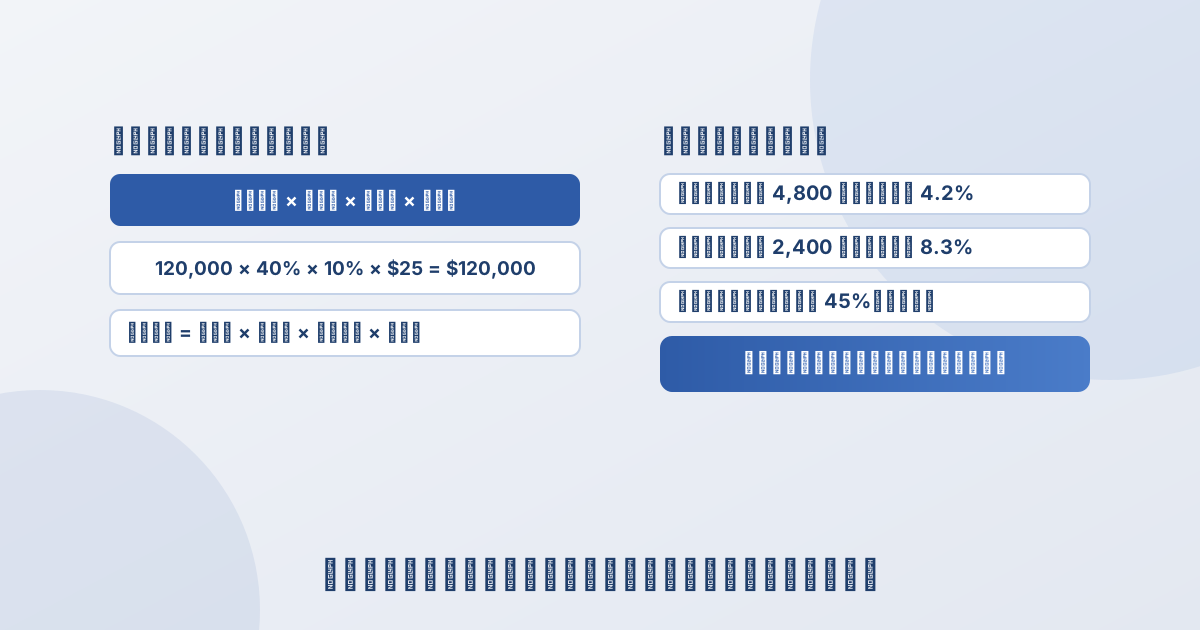
Category monthly visits = monthly search volume × click-through rate = 120,000 × 40% = 48,000 visits; category monthly units = monthly visits × conversion rate = 48,000 × 10% = 4,800 units; category monthly GMV = monthly units × average order value = 4,800 × $25 = $120,000. 'GMV' here is the revenue range this article derives bottom-up through the funnel, not platform or category GMV published by Amazon; the two should not be mixed.
The same arithmetic is very sensitive to CTR and CVR: at 30% CTR and 8% CVR, monthly units fall to 2,880 ($72,000 GMV); at 50% CTR and 12% CVR, they rise to 7,200 ($180,000 GMV). Capacity conclusions therefore have to be given as a range, not a single point.
3. Estimating competitor sales: back-solve from click share rather than believing '10,000 units a month'
Leading competitors' sales are back-solved from shares in the same way: competitor monthly visits = monthly search volume × click-through rate × the competitor's click share; competitor monthly units = competitor monthly visits × the competitor's conversion rate. POE's competition and saturation data and the Top 3 products in Brand Analytics' Top Search Terms both help you locate the competitor to watch and read its share, but you have to multiply out the absolute number yourself.
This example assumes a leading competitor with a 25% click share and a 12% conversion rate (illustrative): competitor monthly visits = 120,000 × 40% × 25% = 12,000, competitor monthly units = 12,000 × 12% = 1,440, and monthly GMV = 1,440 × $25 = $36,000. What official data gives you is search volume and funnel shares, not absolute numbers such as 'a competitor sold 10,000 units'; the 'competitor monthly sales' figures third-party tools show are essentially estimates back-solved from relative indicators such as sales rank, usable only as a range, never as an order ledger.
Counter-examples and alternative explanations
Two counter-examples that are easy to misjudge: first, high search volume but low conversion may be 'price-comparison search' — users are only checking a reference price and do not transact on the site; second, a competitor's high click share may be traffic bought with a large ad budget and does not represent organic demand. The way to tell them apart is to line up daily search volume for the keyword against the competitor's ad placements, price and promotions: competitors that depend heavily on ads swing widely in keyword ranking, convert less organically and see their share fall clearly once they stop advertising.
4. Price-band analysis: anchor prices with the Top 3 products in Top Search Terms
The price band determines whether you can position in a profitable range. In Brand Analytics' Top Search Terms, each keyword is linked to its Top 3 products; pulling the selling price, rating and review count of those three gives the price anchor and competitive density for the niche. This example assumes Top 3 prices of $18, $25 and $39 (illustrative), a median of $25, which places the mainstream price band between $18 and $39. If your landed cost (sourcing plus first-leg freight plus referral fee plus fulfilment; see this site's profit calculation) is above $18, you can only differentiate at the upper end between $25 and $39, and the capacity you can capture shrinks accordingly.
5. Two scenarios: ample capacity and capacity halved
Scenario A (ample capacity): assume a 40% CTR and 10% CVR, with category monthly units of 4,800 and monthly GMV of $120,000. If the seller's target is 200 units a month, that is about 4.2% of the category, and there is room to position within the price band, so the conclusion is that a small trial order is justified, first verifying whether your own conversion rate can reach the assumed figure.
Scenario B (capacity halved): assume a 40% CTR but CVR falling to 5%, with category monthly units of 2,400 and monthly GMV of $60,000. The same 200-unit target rises to 8.3% of the category, requiring more share to be taken from leading competitors, so the conclusion is that you should first establish whether the low conversion reflects weak demand or strong dominance by the leaders before deciding whether to enter.
Scenario C (leader dominance): assume the leading competitor's click share rises to 45% with a 15% conversion rate; it sells about 3,240 units a month and takes $81,000 in monthly GMV, absorbing most of the category's sales. New entrants then face significantly higher acquisition costs, so the conclusion is to walk away unless there is clear differentiation (a lower price band or differentiated features).
6. Execution checklist and stop conditions
In practice, first build a sheet grouped by order date recording keyword, monthly search volume, click-through rate, conversion rate, each competitor's click share, and the Top 3 prices and review counts, then compare the conservative scenario's capacity with your own target sales, and continue only if the ratio reaches a multiple you set in advance — otherwise gather more data or walk away.
- Observation window: at least 90 days, spanning a full quarter, to avoid misreading a single month's promotion or seasonality
- Concentration test: use 'estimated category monthly units ÷ your target monthly units' and treat capacity as tight when the ratio is below 5 times (a merchant-set rule, not an industry standard)
- Continue if: capacity under the conservative scenario (low CTR / low CVR) is still several times the target sales, and there is room to position within the price band
- Stop if: your target share exceeds 10% of category monthly units under any scenario, or a leading competitor's click share stays above 40% and you cannot differentiate
7. Limitations and uncertainties
Three unknowns are most likely to change the conclusion: first, the real field definitions and latency of POE and Brand Analytics inside Seller Central; second, search volume is not all demand, since off-site traffic, repeat purchases and recommendation traffic are not in this funnel; third, the error in back-solving 'competitor sales' from sales rank can reach several times. What evidence would update the judgement: once you can log into Seller Central and read the real search volume, click share and conversion share figures, replace the two scenarios' illustrative inputs with real ones and recompute; if you can measure your own trial-order conversion rate, you can decide whether to scale up or cut losses.
Method and notes
Data basis for this article: Product Opportunity Explorer (niche definition, demand and purchase behaviour, competition and saturation, search terms and search volume, review and return activity, unmet demand) and Brand Analytics (the four dashboard groups, Search Query Performance's query volume, impressions, clicks, cart adds and purchases, the Top 3 products in Top Search Terms, the Professional plan at $39.99 a month and the Brand Registry threshold) are taken from Amazon's US public pages (retrieved on 2026-11-19); sales rank refers to Amazon's public Best Sellers ranking. Every search volume, click-through rate, conversion rate, click share, average order value, price and sales target in this article is an explicitly labelled illustrative example, not a statistic from any platform or shop, and does not mean Nuozhou Digital Intelligence provides real-time sales or back-office data for any platform.
The increment in this article is that it connects what Amazon's official tools 'give' with how sellers 'derive sales' into a recomputable funnel: first limit the official data to search volume and shares rather than absolute competitor sales, then compute the category's monthly units and monthly GMV range bottom-up, and finally turn the capacity conclusion into an enter, trial-order or walk-away decision with two scenarios, instead of copying absolute numbers from third-party tools.
To connect capacity estimates to the full profit account, see this site's Cross-Border E-Commerce Profit Calculation: The Five-Step Subtraction from GMV to Net Profit; for replenishment and safety stock once capacity is estimated, see Inventory Turnover and Replenishment Decisions; for the advertising break-even line after entering a category, see Advertising ROAS and Break-Even ACOS; for comparable methods on product-selection evidence and competitive analysis, see Coupang Data Analysis and Mercado Libre Data Analysis.
This article was prepared with the assistance of an automated research workflow, based on the public sources listed at the end, and has not been reviewed by a human.
Sources
- 1. Amazon, 'Product Opportunity Explorer' (primary source: niche definition, four data categories, unmet demand, the no-guarantee statement and the Best Sellers / Movers & Shakers guidance): view original, retrieved on 2026-11-19
- 2. Amazon, 'Brand Analytics' (primary source: the four dashboard groups, query volume/impressions/clicks/cart adds/purchases in Search Query Performance, the Top 3 in Top Search Terms, the Professional plan at $39.99 a month and the Brand Registry threshold): view original, retrieved on 2026-11-19
- 3. Amazon, 'Amazon Best Sellers' (primary source: public sales ranking, used to observe leading products and relative sales): view original, retrieved on 2026-11-19