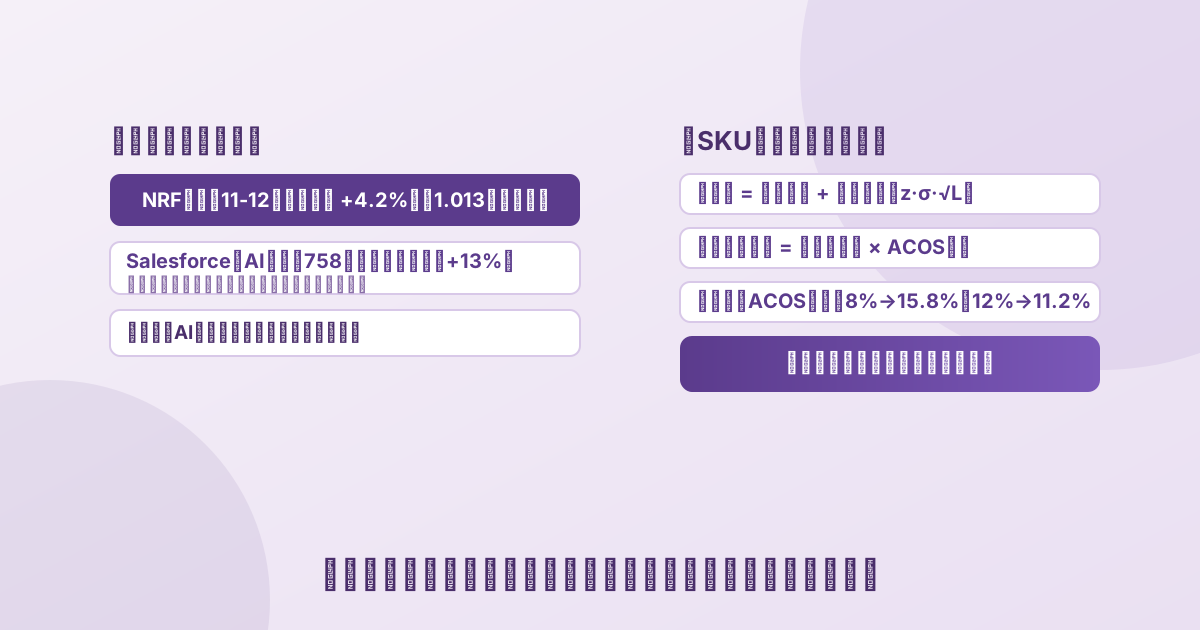
For cross-border sellers selling on Amazon US who are deciding how to adjust prices, advertising and inventory for Black Friday and Cyber Monday 2026 (19 to 30 November), the real question is not how much the overall market grew, but where to set the price floor, whether to join the Deals, how far to raise the ad budget, and which SKUs to keep stocking or clear early. The answer has three layers: first, Amazon has stretched Black Friday into 12 days of daily themed Deals and will cut prices twice each on Black Friday and Cyber Monday (midnight and 8am Pacific Time, with some discounts up to 60% off), so price and traffic peaks are no longer concentrated on a single day and watching only 27 November will miss both ends; second, US October actual retail at +0.2% month on month (with a 90% confidence interval that includes zero, so not significant growth) alongside non-store retail at +1.2% and furniture at -2.3% shows a mild, category-divergent market rather than an all-category peak, so budgets should be allocated by category rather than by the headline total; third, set the price floor where 'the Deal price still exceeds unit contribution', do not chase the main Deal price for SKUs that did not enrol, and defend search with coupons and long-tail keywords.
1. Amazon's Black Friday Week mechanics: 12 days of daily Deals and two price drops each on Black Friday and Cyber Monday
Amazon's official press release (published 9 November 2026) announced that Black Friday Week and Cyber Monday Deals run from 19 to 30 November; Today's Big Deals will cover 12 days of daily themed deal drops spanning toys, tech, fashion, beauty, premium gifts and stocking stuffers; and for the first time prices will be cut twice on Black Friday and twice on Cyber Monday, at midnight and 8am Pacific Time, with some discounts up to 60% off. Amazon is also pushing its AI shopping assistant Alexa for Shopping as the headline Black Friday tool, describing it as able to create lists, track prices, set price-drop alerts and find deals for users.
There are two implications for sellers: first, comparison and purchase triggers are compressed from 'see, compare, buy' into 'price trigger', so sellers who monitor prices too infrequently lose sales between the two drops; second, 60% off is the ceiling for selected Deals, not a sitewide discount, and SKUs that enrolled in a Deal face completely different constraints from those that did not — comparison traffic concentrates on enrolled SKUs during the main Deal, and a non-enrolled SKU that matches the price easily loses money on every order.
AI shopping is the structural variable this Black Friday: research published by Salesforce on 12 November 2026 estimates that AI will drive about $75.8 billion of Cyber Week spending, up 13% year on year, and that shoppers referred by AI convert at more than twice the rate of ordinary e-commerce (based on a survey of more than 2,500 consumers in the US, UK, Canada and Australia). This points the same way as Amazon's Alexa for Shopping push, suggesting incremental demand tilts toward sellers that AI can find and whose data is accurate; but it is a Salesforce estimate and survey, not a record of platform sales.
2. October actuals: why Census +0.2% and NRF +0.15% differ
The US Census Bureau published advance retail sales for October on 17 November 2026: total retail and food services sales of $748.2 billion, +0.2% month on month (±0.4%) and +6.8% year on year (±0.5%), with the agency noting that the 90% confidence interval includes zero — that is, 'there is not sufficient statistical evidence that the monthly change is different from zero' — so +0.2% cannot be treated as significant growth. Within the components, non-store retail (which includes online sellers) rose 1.2% month on month, furniture and home furnishings stores fell 2.3%, clothing stores fell 0.7%, motor vehicle and parts dealers fell 1.6%, and electronics and appliance stores were flat.
The NRF/CNBC Retail Monitor (published 11 November 2026, based on a sample of about 120 million debit and credit cards from Affinity Solutions) gives another basis: total retail excluding auto dealers and petrol stations of $561.7 billion, +0.15% month on month and +3.57% year on year; core retail excluding restaurants of $454.2 billion, +0.26% month on month and +3.36% year on year. Within the components, electronics and appliances led with +9.3% year on year, while furniture and home furnishings fell 2.62% and sporting goods fell 0.44%. The monitor changed methodology in September 2026, so figures before September are not directly comparable year on year.
The two sets of numbers cannot be added together or aligned with each other: Census is a sample survey that adjusts for seasonality but not for price and is revised monthly, while NRF is real card transaction data excluding autos and petrol; Census's +0.2% is month on month while NRF's +9.3% is year on year, so the dimensions differ. For reference, NRF's holiday forecast of 15 October 2026 projected core retail sales up 4.2% year on year for November–December (about $1.013 trillion); October's actual +0.2% month on month does not contradict that full-season forecast, but the former is a single month on month and the latter is two months combined year on year, so they cannot be compared directly. Only one conclusion can be drawn jointly: US retail in October was 'mild and category-divergent' — online and electronics stronger, furniture and apparel weaker — and a +0.2% total does not support 'a peak season across all categories'.
3. The mechanism: how events and data feed into price floors, Deal cadence and ad budgets
Mechanically, the 12-day window and the two daily drops affect sellers through three links: demand to price, competition to advertising, and returns to profit. Stretching Black Friday from a single day into 12 days releases pull-forward demand early and spreads traffic peaks across daily themes and two price drops, so a seller that adjusts prices at only one point in time misses the other peaks. On competition, the main Deal and selected discounts of up to 60% attract comparison traffic, and a non-enrolled SKU that matches the price falls into 'a loss on every order' while staying out entirely means losing category exposure; on returns, peak-season return rates (especially apparel and gifts) are markedly higher than usual, and returns both reduce revenue and create return logistics and unsaleable losses — the item most easily left out of peak-season profit.
Together these three decide that the price floor is not 'lower than competitors' but 'the Deal price still exceeds unit contribution': unit contribution = price × (1 - return rate) - landed cost of goods (including first-leg freight) - fulfilment fees - net loss per return. The analytical contribution of this article is that it translates 'Black Friday starts' into three variables you can apply directly to your own SKUs — the price floor, the timing of price changes for the two drops, and an ad budget allocated by category rather than by the headline total — instead of stopping at 'watch the trend'.
4. A recomputable analysis: two scenarios (enrolled vs not enrolled, illustrative)
Take a cross-border seller selling gifts (assume Bluetooth earphones) on Amazon US; every value below is an explicitly labelled assumption, not data from any real shop, and does not mean Nuozhou Digital Intelligence holds operating data for any specific merchant.
Scenario A: Enrolled in the Deal with deep inventory (illustrative)
Assumptions: the main Deal is locked in; normal monthly sales of 1,000 units, a peak-season coefficient of 2.2 (the ratio of November–December sales to average monthly sales in your own shop over the past two years, not a market figure), peak two-month volume Q = 1,000 × 2.2 × 2 = 4,400 units; Deal price P = $20; landed cost of goods (including first-leg freight) C = $8; referral fee 15% = $3, FBA fulfilment $3.5, other fulfilment $0.5; return rate r = 8%, net loss per return $6; target ACOS 12%.
Calculation: effective revenue = 20 × 0.92 = 18.40; referral fees are refunded with returns, so net fulfilment cost = 3 × 0.92 + 3.5 + 0.5 = 6.76; net return loss = 0.08 × 6 = 0.48; ad spend = 20 × 0.12 = 2.40. Unit net profit = 18.40 - 8 - 6.76 - 0.48 - 2.40 = $0.76, peak two-month net profit = 4,400 × 0.76 ≈ $3,344, net margin about 3.8%.
The price floor for this SKU can sit where 'unit contribution ≥ 0' (break-even ACOS about 15.8%); check competitor Deal prices 48 hours before Black Friday and again 48 hours before Cyber Monday, and in the second drop add spend only on clearance SKUs, not the hero product. Ad budget cap = peak-season sales × ACOS = 4,400 × 20 × 12% = $10,560.
Scenario B: Not enrolled, shallow inventory and a 12% return rate (illustrative)
Assumptions: not in the main Deal; only two inputs change — return rate r = 12% (common for apparel and gifts in peak season) and ACOS = 16% (pushed up by rising peak-season CPCs); everything else is as in Scenario A.
Calculation: effective revenue = 20 × 0.88 = 17.60; net fulfilment cost = 3 × 0.88 + 3.5 + 0.5 = 6.64; net return loss = 0.12 × 6 = 0.72; ad spend = 20 × 0.16 = 3.20. Unit net profit = 17.60 - 8 - 6.64 - 0.72 - 3.20 = -$0.96, meaning a loss of $0.96 per unit sold, and a peak two-month loss of 4,400 × 0.96 ≈ $4,224.
Do not chase the main Deal price (matching it means a loss); concentrate the ad budget on high-converting long-tail terms to defend search, use coupons instead of deep price cuts, and pause scaling once ACOS exceeds the break-even level of 11.2%, clearing unsold SKUs before January.
Break-even: set unit net profit to zero and solve for the ACOS ceiling. At an 8% return rate, pre-advertising unit contribution = 20×0.92-8-(3×0.92+3.5+0.5)-0.08×6 = $3.16, and break-even ACOS = 3.16/20 = 15.8%. At a 12% return rate, pre-advertising unit contribution = 20×0.88-8-(3×0.88+3.5+0.5)-0.12×6 = $2.24 and break-even ACOS = 2.24/20 = 11.2%. Conclusion: raising the return rate from 8% to 12% pushes break-even ACOS from 15.8% down to 11.2%, eating up almost one-third of the room available for advertising.
5. Counter-examples and alternative explanations
Counter-example one: non-gift, low-sensitivity categories. If your SKU is industrial parts or consumables bought repeatedly all year, the 12-day Black Friday window and the +0.2% total barely move your demand, and stocking to a peak-season coefficient would over-invest in inventory. Counter-example two: weak categories such as furniture and home. Census at -2.3% month on month and NRF at -2.62% year on year both point to weakness in furniture and home; if you sell in this category, the October data instead suggests demand is contracting, so chasing volume with Deals is wrong and inventory and returns should be controlled. Alternative explanation: +0.2% may be nominal growth from higher prices rather than higher unit demand, and unit demand (pieces) need not grow in step; NRF's +9.3% for electronics is year on year and may include price effects.
6. Action plan and stop conditions
Turning this judgement into an executable cadence requires collecting four types of fields, setting two baselines and defining one stop condition:
- Fields to collect: order volume, return volume and return reasons, ad spend and ACOS, and competitor Deal prices and bids, by SKU for November–December of the past two years
- Baselines to set: your own peak-season coefficient (peak-month sales / average monthly sales), return rate, and pre-advertising unit contribution = price × (1 - return rate) - landed cost of goods - fulfilment fees - net return loss
- Price-change timing: check competitor Deal prices 48 hours before Black Friday and again 48 hours before Cyber Monday; in the second drop add spend only on clearance SKUs, not the hero product
- Observation windows: compare three stretches — the 19–26 November warm-up, Black Friday week (23–29 November) and Cyber Monday (30 November)
- Stop conditions: pause scaling when real-time ACOS exceeds the break-even line (15.8% at an 8% return rate in the example) with no improvement for three consecutive days; stop immediately if a non-enrolled SKU turns negative on unit contribution after matching a price
- Fill in the data: replace the assumptions with your own real return rate, ACOS and peak-season coefficient and recalculate
To be clear: the 15.8% and 11.2% break-even ACOS figures are example thresholds derived from the assumptions stated in this article, not industry standards; your own thresholds must be recalculated with your actual price, cost of goods, fees and return rate.
7. Limitations and uncertainties
Four unknowns are most likely to change the conclusion: First, the 90% confidence interval around Census's +0.2% includes zero, and the agency itself says there is not sufficient statistical evidence that the monthly change is different from zero, so using it as evidence of growth does not stand up. Second, 60% off is a ceiling for selected Deals rather than a sitewide discount, and main Deals usually require enrolment in advance, leaving limited room to squeeze into one during the event; third, the two sets of figures cannot be aligned (survey sample vs card transactions, month on month vs year on year), so any judgement that 'October retail means Black Friday will definitely be good or bad' exceeds what the data can support; fourth, every single-SKU figure here is an explicitly labelled assumption, and replacing it with your real return rate, ACOS and peak-season coefficient may turn a thin profit into a loss or the reverse. Recalculate once you have your own shop's real data.
Method and notes
Data basis for this article: Amazon's Black Friday Week mechanics are taken from its official press release of 9 November 2026 (event period 19–30 November, 12 days of daily themed Deals, two price cuts each on Black Friday and Cyber Monday, some discounts up to 60% off); the Census figures are from the advance October retail sales release published by the US Census Bureau on 17 November 2026 (total retail and food services $748.2 billion, +0.2% month on month and +6.8% year on year, with a 90% confidence interval that includes zero); the NRF figures are from the CNBC/NRF Retail Monitor published on 11 November 2026 (total retail excluding autos and petrol $561.7 billion, +0.15% month on month and +3.57% year on year) and the holiday sales forecast of 15 October 2026 (core retail up 4.2% year on year for November–December); the Salesforce figures are from its 'AI-first holiday' research of 12 November 2026 (a survey of more than 2,500 consumers in the US, UK, Canada and Australia). Census and NRF differ in geography, statistical population, period and method, so this article sets them side by side only and does not add or convert them. All single-SKU scenarios are labelled assumptions, and the calculation order (reduce revenue and refundable fees for returns first, then list the net return loss and ad spend separately) avoids double-counting refunds and returns.
To take unit net profit further into net profit and fixed costs, see Cross-Border E-Commerce Profit Calculation: The Five-Step Subtraction from GMV to Net Profit; for ACOS definitions and historical reports in peak-season advertising, compare Amazon Advertising Data Analysis; for how returns affect replenishment decisions, see Coupang Data Analysis; for a Southeast Asian comparison of peak-season campaigns, see Double 11 Southeast Asia E-Commerce Data.
This article was prepared with the assistance of an automated research workflow, based on the public sources listed at the end, and has not been reviewed by a human.
Sources
- 1. Amazon, 'Amazon's Black Friday Week and Cyber Monday Return November 19-30 with Millions of Deals to Deliver Joy This Holiday Season' (primary source, published 2026-11-09): view original, retrieved on 2026-11-19
- 2. U.S. Census Bureau, 'Advance Monthly Sales for Retail and Food Services, October 2026' (primary source, published 2026-11-17): view original, retrieved on 2026-11-19
- 3. National Retail Federation, 'CNBC/NRF Retail Monitor Shows Another Month of Sales Growth in October' (primary source, published 2026-11-11): view original, retrieved on 2026-11-19
- 4. National Retail Federation, 'NRF Forecasts 2026 Holiday Sales Growth as Consumers Remain Resilient' (primary source, published 2026-10-15): view original, retrieved on 2026-11-19
- 5. Salesforce, 'New Data: Holiday Shoppers Will Rely on Agents. Retailers Must Be Ready.' (primary source, published 2026-11-12): view original, retrieved on 2026-11-19