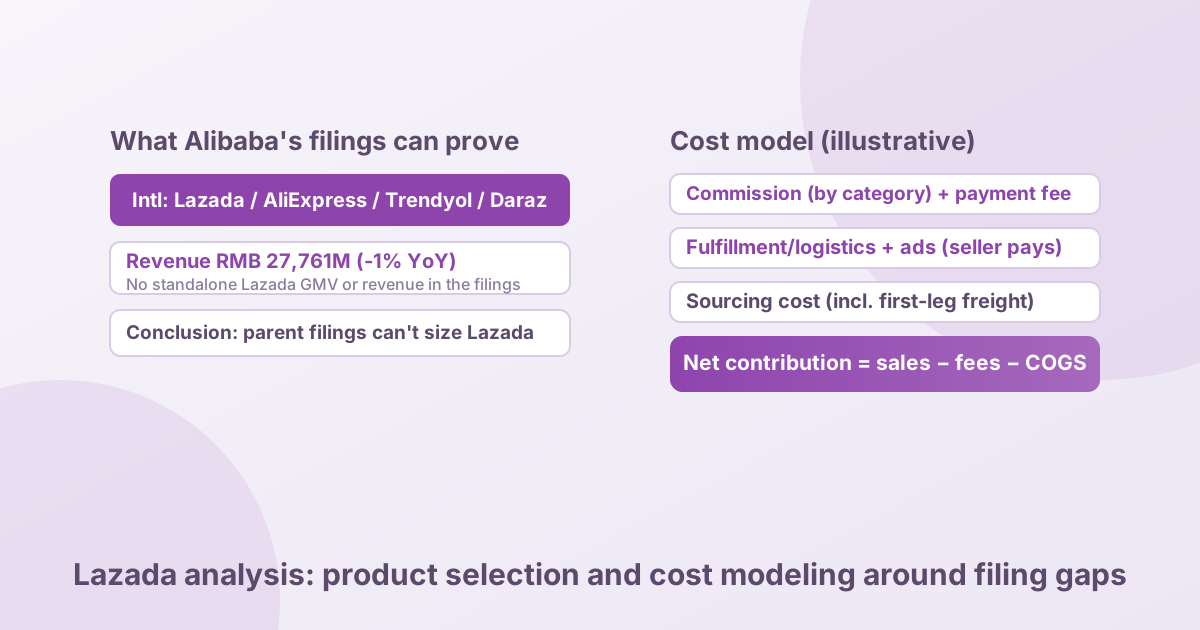
For cross-border sellers who want to enter Lazada's six Southeast Asian sites (Malaysia, Singapore, the Philippines, Thailand, Vietnam and Indonesia), the first thing to face is an awkward fact: Alibaba, Lazada's parent company, publishes no standalone Lazada GMV or revenue in its filings. So the real question is not how big Lazada's overall business is, but how, when the company discloses no standalone figures and the fee page has to be checked behind a login, I should decide which site to start with and turn commission, payment fees and fulfilment fees into a per-unit cost. The answer comes in three layers: accept that evidence boundary first, switch to the seller centre's own data and the official fee pages, and finally use hypothetical examples to turn the fee structure into unit contribution; only after replacing the hypothetical values with the real rates in your own back office can the numbers be used for pricing and site selection.
1. Start with the evidence boundary: Alibaba's filings contain no standalone Lazada figures
Financial statements can describe the company's overall operating background, but they cannot establish an opportunity in a particular Lazada site or category; Alibaba reorganised its segments from the June 2026 quarter, Lazada sits inside International E-commerce, and the filing text contains no standalone Lazada revenue or GMV. According to Alibaba's June-quarter 2026 results, the company merged the former Alibaba International Digital Commerce Group (AIDC) into the new Alibaba E-commerce Group and reports it externally in four parts — China E-commerce, China Quick Commerce, International E-commerce and Global Wholesale — with Lazada in International E-commerce. The segment's June-quarter 2026 revenue was RMB 27,761 million (about US$4.091 billion), down 1% year on year (RMB 28,177 million a year earlier). As of the 18 November 2026 search date this is Alibaba's latest published quarterly result; the September-quarter result is scheduled for 19 November 2026 (see the quarterly results page), and it will still need to be checked for any added Lazada segment detail.
The key is disclosure granularity: the body of the filing contains no standalone revenue or GMV for Lazada (nor for Trendyol or Daraz), and the only platform named is AliExpress, which "delivered operating profit this quarter". So the -1% cannot be described as Lazada shrinking, still less used to infer an opportunity in a particular site or category. Two layers separate segment revenue from demand in your category: the segment reports Lazada together with AliExpress, Trendyol and Daraz, so you cannot tell which platform the growth comes from; and segment revenue is not GMV, because revenue includes advertising, logistics and other value-added income, which is a different thing from what buyers spend.
This makes Lazada clearly different from Shopee, Coupang and Mercado Libre: Sea's filings disclose Shopee as a separate segment, and Coupang and Mercado Libre each publish their own reports, so a filing-to-market judgement is possible; Lazada cannot take that step and has to rely on other data sources. Compare this site's "Shopee Data Analysis", "Coupang Data Analysis" and "Mercado Libre Data Analysis".
2. The two right data sources for Lazada: the seller centre and the official fee page
Since the parent company's filings cannot help, Lazada data analysis should rest on two bases closer to operations. The first is your own store's seller centre data (visitors, conversion, orders, advertising, statements), which is first-party operating data reflecting only your store, not the category or the whole platform. The second is the platform's official fee page, used to check commission, payment fees and fulfilment fees, but it usually requires a seller-centre login. During research for this article the official fee page, which requires a login, could not be read (it was blocked by the platform's anti-scraping measures), so no specific rate is quoted and only the modelling method is set out.
Three kinds of data also need to be kept apart: your own store's orders and settlement records are actual operating data; public competitor rankings can only define what to watch, not prove new demand; third-party sales estimates (such as inferring from review growth) are modelled estimates with an unknown error range, suitable for screening candidates and watching trends but not for deciding purchase quantities directly. When you see "this product sells N units a month", first establish whether it comes from your own store's orders, licensed transaction data, or a review or ranking model.
3. A reproducible fee model: commission, payment fee and fulfilment fee are several deductions
The formula below, with two scenarios, turns Lazada's platform costs into unit contribution. Every operating input is a hypothetical example in Malaysian ringgit (MYR), not a platform average, a recommended price or a real seller's result; the commission rate and payment fee are hypothetical, differ by site and category, and must follow the seller centre statement. For simplicity, assume no platform-sponsored discounts: net contribution per unit = transaction value × (1 − commission rate − payment fee rate) − fulfilment and logistics fee − advertising − goods cost (including first-leg freight). This stops at net contribution per unit after platform take, fulfilment, advertising and goods cost, and does not deduct taxes or other period costs.
Under these assumptions, net contribution per unit = 20 − 1.20 − 4 − 1.5 − 6 = MYR 7.30, a net contribution rate of about 36.5%; each additional ringgit of advertising cuts unit contribution by one ringgit, a linear relationship under the current assumptions that does not mean prices, returns or fulfilment costs stay unchanged as you scale.
Scenario A: low ticket size, paid advertising for volume (hypothetical example)
Assume a transaction value S = MYR 20, a commission rate of 4% plus a payment fee of 2%, for a combined 6% take (20 × 6% = MYR 1.20), advertising of MYR 4 (20% of transaction value), a fulfilment and logistics fee of MYR 1.5 and goods cost of MYR 6.
Net contribution per unit = 20 − 1.20 − 4 − 1.5 − 6 = MYR 7.30, a net contribution rate of about 36.5%.
Scenario A is positive but thin on the hypothetical inputs, so cap advertising at your own limit and fix conversion first rather than adding budget; until you have checked real rates, do not use these hypothetical figures as a pricing basis.
Scenario B: high ticket size, mostly organic traffic (hypothetical example)
Assume a transaction value S = MYR 80, a commission rate of 4% plus a payment fee of 2%, for a combined 6% take (80 × 6% = MYR 4.80), no advertising, a fulfilment and logistics fee of MYR 2 and goods cost of MYR 30.
Net contribution per unit = 80 − 4.80 − 0 − 2 − 30 = MYR 43.20, a net contribution rate of about 54%.
Scenario B is clearly fatter on the hypothetical inputs, so protect the organic traffic advantage and put incremental budget into main images, detail pages and ratings rather than spreading advertising indiscriminately and diluting margin.
Sensitivity: in Scenario A, if advertising falls from 20% to 10% (MYR 2), net contribution per unit = 20 − 1.20 − 2 − 1.5 − 6 = MYR 9.30 (46.5%); if it rises to 30% (MYR 6), net contribution = 20 − 1.20 − 6 − 1.5 − 6 = MYR 5.30 (26.5%). This shows that on a low ticket size advertising is the most sensitive lever, while the platform take and fulfilment fee are relatively fixed shares that can almost only be improved by cutting advertising or raising prices.
4. Counter-cases and alternative explanations: when not to copy segment numbers across
A counter-example that would overturn the view: International E-commerce segment revenue fell 1% year on year, yet your target category is scaling, because the segment decline may come mainly from AliExpress or a single market and have nothing to do with your site and category. The direction of segment revenue therefore cannot directly tell you whether to enter a given Lazada site or not.
Another alternative explanation is that a fall in a SKU's unit contribution is not necessarily a platform fee increase; it could be your own change in ad bids, return rate or purchase price, or a move in the local exchange rate. The way to tell is to go back to the seller centre statement and check the actual deductions for commission, payment fee, fulfilment fee and advertising line by line, rather than attributing every profit decline to the platform.
5. Action plan: what to collect, what to use as a baseline, and when to continue or stop
Start by building a record per SKU grouped by order date, keeping site, category, transaction value, commission rate and actual commission, payment fee, fulfilment and logistics fee, advertising spend, goods cost, refund and return deductions and actual payouts; then recompute unit contribution on mature orders from the most recent complete settlement cycle as the baseline.
- Before choosing a site: confirm the price band and number of competitors for your target category on the target site, run a first coarse screen with a hypothetical fee rate and hypothetical ticket size, and flag the sites where the platform take and fulfilment share are too high
- Check the rates: log in to the seller centre and replace the hypothetical commission and payment fee rates with the real rates for the target site and category, then check order by order whether anything is over- or under-deducted
- Small-scale test: list a small number of SKUs first, spend two weeks observing one full cycle of within-week variation, then wait for the returns and settlement of the tested orders to mature, rather than computing contribution on immature orders
Continue when, after recomputing mature orders on the real statement, net contribution per unit is positive and meets your own target. Adjust when traffic is high but conversion is low: fix the listing, price and main image first rather than adding more advertising. Stop when unit contribution stays negative, when the contracting entity and tax responsibility for that site cannot be confirmed, or when the real rates cannot be obtained from the seller centre — collect the data first and decide after that, rather than expanding on hypothetical values.
6. Limitations and uncertainty
The unknowns most likely to change the conclusion are the real commission and payment fee rates on the target site, whether you use Lazada's official fulfilment, and the real return rate and first-leg cost; this article could not read Lazada Seller Center's official fee page, which requires a login, so it quotes no specific rate and every rate is a hypothetical value. Once you have the seller centre statement, recompute the thresholds; public material alone cannot tell how much inventory any particular seller should commit.
This article discusses a general analytical method for Lazada's public data and official fees; it does not mean that Nuozhou Digital Intelligence already provides real-time sales, advertising back-end or commercial data coverage for Lazada. Fees and taxes must be defined by country, seller entity and contracting model.
Method and disclosure
Data basis: the segment data comes from Alibaba's June-quarter 2026 results press release (published 20 August 2026, accessed 18 November 2026) and the business structure from Alibaba's "Our Businesses" page; Lazada sits inside Alibaba's International E-commerce business and is reported together with AliExpress, Trendyol and Daraz, with no standalone GMV or revenue figure. This article could not read Lazada Seller Center's official fee page, which requires a login (it was blocked by anti-scraping), so it quotes no specific rate and every fee calculation in the text uses clearly labelled hypothetical values.
The increment here is to connect the parent company's segment disclosure, the seller centre's operating data and the costs in order settlement into a single decision chain, and to make explicit how to model costs honestly when official rates cannot be publicly verified, rather than translating Alibaba's growth or decline directly into a decision to enter Lazada.
To take unit contribution further down to net profit, see "Cross-Border Profit Accounting: The Five-Step Bridge from GMV to Net Profit"; for background on the six Southeast Asian sites and how to choose between them, see "Southeast Asia's Six Major E-Commerce Sites: A September 2026 Review" and "Taking a Brand into Southeast Asia: How to Choose the First Stop".
References
- 1. Alibaba Group, "Alibaba Group Announces June Quarter 2026 Results" (primary source, published 20 August 2026): read the original, accessed 18 November 2026
- 2. Alibaba Group, "Our Businesses" (primary source): read the original, accessed 18 November 2026
- 3. Alibaba Group Investor Relations, "Earnings and Financials — Quarterly Results" (primary source): read the original, accessed 18 November 2026
This article was prepared with the assistance of an automated research workflow and is based on the public sources listed at the end; it has not been reviewed by a human editor.