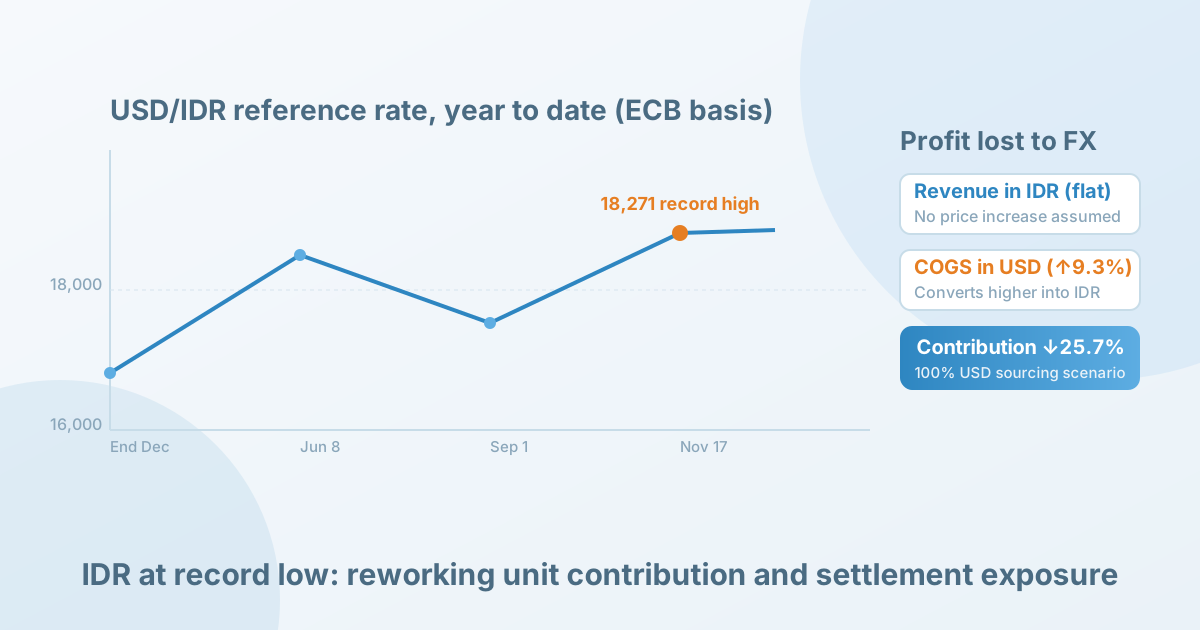
For cross-border sellers on the Indonesian sites of Shopee, Lazada and TikTok Shop who collect revenue in Indonesian rupiah (IDR) and buy in US dollars or renminbi, the question after the rupiah touched a record low on 17 November 2026 is not how much further it will fall. It is how much of my unit contribution the exchange rate has eaten, and whether I should raise prices, shorten the settlement cycle or move sourcing local. The answer comes in three layers: separate the currency mix of purchasing from the settlement currency, recompute unit contribution with European Central Bank reference rates, and then choose an action based on the size of the exposure. Under the hypothetical examples in this article, a seller buying 100% in US dollars has seen unit contribution shrink by about a quarter this year, while a seller with a high share of local purchasing is affected far less.
1. What happened: the rupiah hit a record low, but the low has several definitions
The European Central Bank's reference rates for 17 November show EUR/IDR at 20,077.73 and EUR/USD at 1.0989; dividing one by the other gives USD/IDR of about 18,271, the highest verifiable level — that is, the weakest rupiah — for this ECB reference series since late 2019. Chwang reported on 17 November that the rupiah touched an intraday record low of 18,288 against the dollar that morning and had fallen nearly 10% against the dollar this year; the report also cited MUFG's expectation of 18,350 by the fourth quarter and BNP Paribas's forecast of 18,500 next year.
Recomputing the year-to-date move with ECB reference rates: USD/IDR rose from 16,716 on 31 December 2025 to 18,271 on 17 November, meaning the dollar appreciated 9.3% against the rupiah, or the rupiah depreciated about 8.5% against the dollar. That agrees in direction with the near-10% in the media report, with a small numerical difference; this article uses the ECB reference rates. Note that this was not a one-way straight line: the reference series shows the rupiah first touching 18,151 on 8 June, then recovering to 17,745 on 1 September, before weakening again from late October and setting a new high. A one-day record does not mean a long-term one-way trend, and sellers should not lock in long-term prices off a single day's rate.
| Measure | Value | Source and meaning |
|---|---|---|
| Intraday rate | 18,288 | The intraday level reported by Chwang for the morning of 17 November, not an official close |
| ECB reference rate | 18,271 | ECB 17 November EUR/IDR ÷ EUR/USD, verifiable first-hand |
| Platform settlement rate | Not obtained | The actual FX rate and settlement currency of Shopee, Lazada and TikTok Shop must be verified in the seller back office |
| Institution forecasts | 18,350 / 18,500 | MUFG for Q4 and BNP for next year; forecasts, not realised rates |
2. Mechanism: how depreciation squeezes unit contribution through purchasing cost and revenue conversion
For a seller who collects in IDR and buys in US dollars (or renminbi), depreciation squeezes unit contribution through two chains. First, goods cost is denominated in dollars, so its IDR cost rises with USD/IDR — one dollar of goods went from 16,716 rupiah at the start of the year to 18,271, an increase of 1,555 rupiah. Second, IDR revenue already collected shrinks when converted back into dollars or renminbi. The settlement cycle decides which day's rate enters the P&L: for the same order, the difference between the transaction-date rate and the settlement-date rate directly changes the amount of home currency actually received.
The weight of the two chains is set by the currency mix of purchasing: the local (IDR) portion is untouched by the exchange rate, and only the dollar or renminbi portion is exposed to USD/IDR. The currency mix of purchasing is therefore the first input for judging exposure, rather than the blanket claim that any seller in Indonesia carries FX risk. If platform commission and advertising are charged in IDR they are not converted twice (the actual seller back-office statement governs); this article does not introduce an unverified USD/CNY rate, and sellers buying in renminbi face the same direction, simply multiplied by one more USD/CNY rate.
3. A reproducible analysis: the unit-contribution formula and two hypothetical scenarios
The formula below, with two hypothetical scenarios, turns the exchange rate into unit contribution. Every operating input is a hypothetical example, in Indonesian rupiah (IDR), not a platform average, a recommended price or a real seller's result. Unit contribution (IDR) = transaction value × (1 − platform fee rate) − goods cost (USD) × USD/IDR − other IDR costs. For simplicity, assume a combined platform commission and fulfilment fee of 12%, other IDR costs of 15,000 rupiah, a transaction value of 250,000 rupiah, and no advertising, returns or taxes.
Scenario A: 100% US-dollar purchasing, no price increase (hypothetical example)
Assume a transaction value of 250,000 rupiah, a platform fee rate of 12% (net revenue 220,000 rupiah), goods cost of 9 US dollars all denominated in dollars, and other IDR costs of 15,000 rupiah. At the start-of-year reference rate of 16,716: unit contribution = 220,000 − 9×16,716 − 15,000 = 54,556 rupiah; at the 17 November reference rate of 18,271: unit contribution = 220,000 − 9×18,271 − 15,000 = 40,561 rupiah. Unit contribution has fallen 13,995 rupiah this year, a drop of 25.7%.
Sensitivity: if the rate moves further to BNP's forecast of 18,500, unit contribution = 220,000 − 9×18,500 − 15,000 = 38,500 rupiah, another 29.4% below the start of the year. With 100% dollar purchasing, every 1 rupiah move in the rate is multiplied nine times into unit cost — the highest-exposure case. When purchasing is 100% in dollars and the contribution rate falls below your own floor, shorten the settlement cycle first and assess a 4%–6% price rise, rather than continuing to scale at the old price.
Scenario B: 70% local purchasing, with a 6% price increase (hypothetical example)
Assume a transaction value of 250,000 rupiah and a platform fee rate of 12%, but split goods cost into 70% local (105,000 rupiah, unaffected by the exchange rate) plus 30% dollar (2.7 US dollars), with other IDR costs of 15,000 rupiah. With no price increase and at the 17 November reference rate: unit contribution = 220,000 − 105,000 − 2.7×18,271 − 15,000 = 50,668 rupiah, down 7.7% from 54,867 rupiah at the start of the year — far less than the 25.7% in Scenario A.
With a 6% price increase to 265,000 rupiah: net revenue is 233,200 rupiah, and unit contribution = 233,200 − 105,000 − 2.7×18,271 − 15,000 = 63,868 rupiah, a contribution rate of 24.1%, even higher than the 54,867 rupiah at the start of the year with no price increase. Sellers with a high share of local purchasing should shorten the settlement cycle first, keep any price increase within 6% and validate it with a conversion test, rather than making one large increase.
4. When the impact is small: counter-cases and alternative explanations
A scenario that would overturn the idea that depreciation means raising prices: the platform settles in dollars, or the seller has passed the FX risk to its supplier, or most of the goods cost comes from local Indonesian sourcing. In that case the exposure itself is small, and a hasty price rise would only cost volume. Another alternative explanation is that a fall in unit contribution is not necessarily the exchange rate; it could be your own change in ad bids, return rate or purchase price. The way to tell is to go back to the statements and compare the FX move with the operating change separately, instead of attributing every profit decline to the rupiah.
One more thing to watch: where category price elasticity is high, the volume lost to a price increase can push gross profit down rather than up. Indonesian sites generally have low ticket sizes (see this site's review of six Southeast Asian sites, which finds Indonesian average prices of 15–20 yuan and scale built on unit counts), and low-price categories are more sensitive to price increases; a 6% rise cannot simply be assumed to be cost-free.
5. Action plan: what to collect, what to use as a baseline, and when to continue or stop
Start by building a record per SKU grouped by order date, keeping transaction value (IDR), platform fee rate and actual deductions, goods cost and its currency (USD, renminbi or IDR), purchase price and the rate on the order date, settlement date and the currency actually received, the number of days in the settlement cycle, and other IDR costs.
- Size the exposure: recompute the last 90 days of unit contribution using goods cost (foreign currency) × the USD/IDR rate on the settlement date, and put the order-date rate alongside it in a second column to pin down which day actually enters the P&L
- Set the action: for 100% dollar purchasing with a contribution rate below your floor, shorten the settlement cycle first and assess a 4%–6% price rise; where local purchasing dominates, shorten terms before raising prices sharply
- Run a test: before raising prices, run a two-week small-traffic test against competitor price bands and conversion, to avoid a one-off increase across every SKU
Use the most recent complete settlement cycle — at least one calendar month, including one full payout — and recompute unit contribution on mature orders as the comparison baseline. Continue when, after the price rise, both conversion and gross profit are positive and the FX exposure has actually shrunk after shortening settlement. Adjust when the price rise causes a clear fall in conversion: roll the price back and move to local sourcing or price locking. Stop when unit contribution stays negative, when the platform settlement currency and payout date cannot be confirmed, or when no hedging tool is available — in those cases pause any increase in ad spend.
6. Limitations and uncertainty
The unknowns most likely to change the conclusion are the platform's actual settlement currency and payout cycle (the Indonesian sites of Shopee, Lazada and TikTok Shop may differ; verify in the seller back office), the real currency mix of purchasing, category price elasticity, and whether a usable hedging tool exists. This article could not obtain Bank Indonesia's official JISDOR reference rate (the bi.go.id connection was refused), so it sets the ECB reference rate alongside Chwang's intraday quote; the record low of 18,288 comes from secondary reporting, and the near-10% year-to-date fall recomputes, on ECB reference rates, to a 9.3% dollar appreciation against the rupiah (an 8.5% rupiah depreciation against the dollar).
This article discusses a general analytical method for sellers on Indonesian sites under FX moves; it does not mean that Nuozhou Digital Intelligence already provides live IDR rates, platform settlement data or FX hedging services. Fees and taxes must be defined by country, seller entity and contracting model.
Method and disclosure
Data basis: USD/IDR is converted from the ECB EUR/IDR reference rate of 20,077.73 divided by the EUR/USD reference rate of 1.0989, giving 18,270.75 (rounded to 18,271 in the text), with the series since late 2019 verified through Frankfurter (a mirror of the ECB reference rates); the intraday 18,288, the record low and the MUFG and BNP forecasts come from Chwang's report of 17 November. Every operating figure in the article (transaction value, fee rate, goods cost, other costs) is a hypothetical example.
FX exposure ultimately has to land in unit profit; see "Cross-Border Profit Accounting: The Five-Step Bridge from GMV to Net Profit". For the size and ticket-size context of the Indonesian market, see "Southeast Asia's Six Major E-Commerce Sites: A September 2026 Review" and "Taking a Brand into Southeast Asia: How to Choose the First Stop".
References
- 1. European Central Bank, "EUR/IDR daily reference rate (EXR.D.IDR.EUR.SP00.A)" (primary source, 2026-11-17): read the original, accessed 18 November 2026
- 2. European Central Bank, "EUR/USD daily reference rate (EXR.D.USD.EUR.SP00.A)" (primary source, 2026-11-17): read the original, accessed 18 November 2026
- 3. Chwang, "Rupiah Hits Record Low of 18,289, Down Nearly 10% Against the Dollar This Year" (2026-11-17): read the original, accessed 18 November 2026
This article was prepared with the assistance of an automated research workflow and is based on the public sources listed at the end; it has not been reviewed by a human editor.