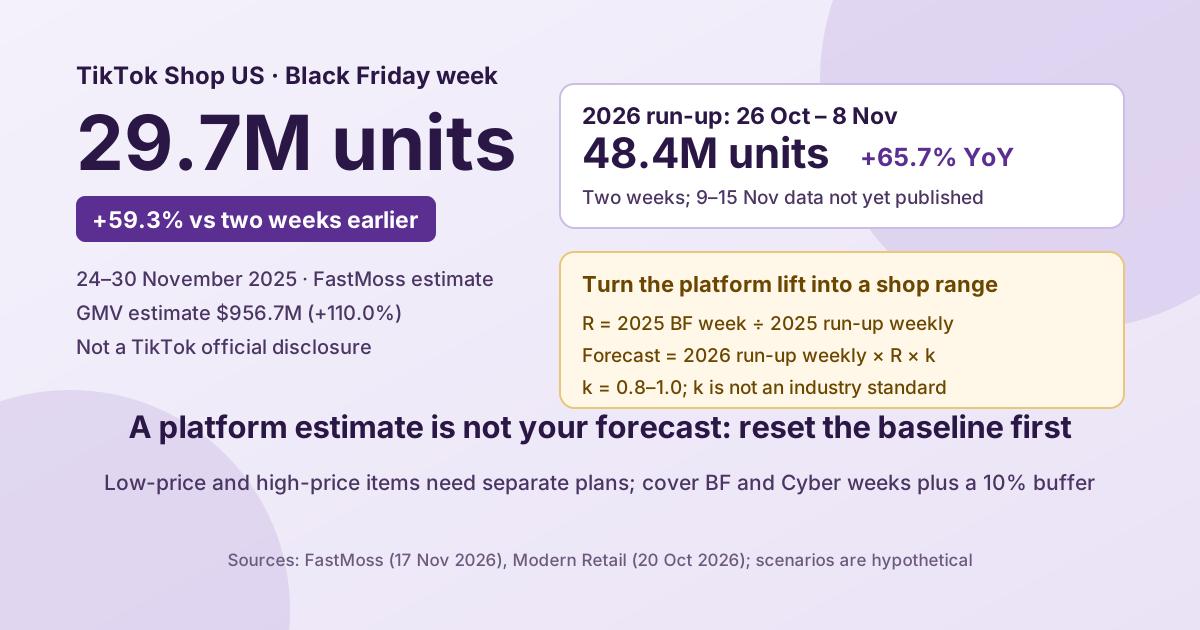
If you sell on TikTok Shop US and are deciding how much stock to commit for Black Friday week (23–29 November 2026, with Black Friday on 27 November) and how much to reserve for creators and ads, the short answer is: treat FastMoss's 29.7 million units and +65.7% as a directional range, not as a forecast for your shop. Start with your own ratio of 2025 Black Friday week units to your 2025 run-up weekly average, multiply it by your 2026 run-up weekly average, and apply a 0.8–1.0 pass-through haircut to get a stock range. Then use two-week stock cover and unit contribution to work back to the affiliate and ad ceilings. Every FastMoss figure is a third-party estimate for the US market, not a TikTok disclosure; complete 2026 Black Friday week actuals will not exist until after 29 November.
1. Put the numbers back into their definitions: 29.7 million is a 2025 Black Friday week estimate, not a 2026 forecast
In its 17 November 2026 update, “TikTok Shop Black Friday Statistics 2026: 12 Numbers to Know,” FastMoss estimates that US TikTok Shop sold 29,746,408 units in Black Friday week 2025 (24–30 November), 59.3% more than 18,672,255 in 10–16 November, 46.9% more than 20,255,805 in 17–23 November and 35.8% more than 21,910,029 in Black Friday week 2024. The same article estimates Black Friday week GMV at $956.7 million, 110.0% above $455.5 million in the 2024 week. Every figure comes from FastMoss's weekly US market data, and the article states plainly that all numbers are FastMoss estimates for the US market.
FastMoss itself cautions that GMV is modelled and units are the more direct count; it leads with units because they are steadier for new listings. Dividing the two estimates gives an implied GMV per unit of $32.16 in Black Friday week 2025 and $20.79 in the 2024 week, 54.7% higher. That 54.7% is not an average selling price disclosed by FastMoss; it is this article's cross-check of the two estimates. If their coverage differs, the ratio is directional, not a precise price increase.
The 2026 run-up is also accelerating. FastMoss estimates 48,448,581 units in the US from 26 October to 8 November 2026, 65.7% above 29,234,358 in 27 October–9 November 2025; the week of 2–8 November 2026 alone had 26,019,932 units, already 87.5% of Black Friday week 2025 volume. FastMoss also notes that the week of 9–15 November 2026 had not been published when it pulled the data on 16 November, so the run-up covers two weeks; Black Friday week 2026 ends on 29 November, and its actuals are not available yet.
| Metric | Period | FastMoss estimate | Comparison |
|---|---|---|---|
| Black Friday week units | 24–30 November 2025 | 29,746,408 units | +59.3% vs 10–16 November; +35.8% vs Black Friday week 2024 |
| Black Friday week GMV | 24–30 November 2025 | $956.7 million | +110.0% vs $455.5 million in the 2024 week |
| Implied GMV per unit | 24–30 November 2025 | $32.16 per unit | $20.79 in the 2024 week, +54.7% (this article's division of the two estimates) |
| 2026 run-up units | 26 October–8 November 2026 | 48,448,581 units | +65.7% vs 29,234,358 in the same weeks of 2025 |
| 2026 week 45 units | 2–8 November 2026 | 26,019,932 units | 87.5% of Black Friday week 2025 |
| Cyber Monday week units | 1–7 December 2025 | 25,377,196 units | −14.7% vs Black Friday week; +35.9% vs 10–16 November |
The easiest misreading of this table is to treat “+59.3%” and “+65.7%” as the same base. The first compares Black Friday week 2025 with 10–16 November 2025; the second compares the two-week 2026 run-up with the same weeks of 2025. Adding the two percentages, or treating +65.7% as Black Friday week's year-over-year growth, is wrong.
2. What the data shows: Black Friday concentrates demand, video sales rise and LIVE sessions with sales fall
Category differences are more useful than the platform total. Among FastMoss's ten largest categories, menswear and underwear rose 99.6% in Black Friday week versus 10–16 November, toys and hobbies 79.0%, phones and electronics 71.8%, fashion accessories 67.5%, beauty and personal care 54.8%, home supplies 44.7% and health 31.4%. Beauty and personal care remained the largest category by units, with 6,330,574 units, or 21.3% of all units that week. These are FastMoss category estimates, not the growth rate of your subcategory; within “beauty,” item-level differences can be much larger than the category average.
| Category | 10–16 November 2025 units | Black Friday week 2025 units | Change |
|---|---|---|---|
| Beauty and personal care | 4,089,959 | 6,330,574 | +54.8% |
| Womenswear and underwear | 2,186,795 | 3,204,141 | +46.5% |
| Home supplies | 1,465,233 | 2,120,110 | +44.7% |
| Fashion accessories | 1,123,489 | 1,881,626 | +67.5% |
| Phones and electronics | 922,698 | 1,585,651 | +71.8% |
| Toys and hobbies | 779,867 | 1,396,099 | +79.0% |
| Menswear and underwear | 577,189 | 1,151,846 | +99.6% |
The price structure is also concentrated: 71.9% of Black Friday week units sold at $30 or less, 51.9% at $20 or less, and the $20–30 band was the largest single band at 20.0%. FastMoss warns that these are shares of units, not GMV; the bands do not add up to weekly GMV, bands above $60 are omitted, and “71.9% of units at $30 or less” cannot be translated into “71.9% of GMV comes from the low-price band.” For a seller, the implication is that the platform's Black Friday increment is tilted toward low-price, high-frequency items; high-price items must be validated with their own units and GMV, not with the platform's unit lift.
| Metric | Black Friday week 2025 | Comparison period | Change |
|---|---|---|---|
| Units | 29,746,408 | 21,910,029 in Black Friday week 2024 | +35.8% |
| GMV estimate | $956.7 million | $455.5 million in Black Friday week 2024 | +110.0% |
| Videos with sales | 1,542,999 | 1,399,964 in 10–16 November | +10.2% |
| LIVE sessions with sales | 59,190 | 66,990 in 10–16 November | −11.6% |
| Share of units at $30 or less | 71.9% | — | — |
| Share of units at $20 or less | 51.9% | — | — |
The video-versus-LIVE split deserves separate attention. Black Friday week had 1,542,999 videos with sales, 10.2% more than 10–16 November; LIVE sessions with sales fell 11.6% to 59,190. FastMoss explicitly says these are counts of videos and sessions that made at least one sale, not the performance of any single video or session. It also gives category detail: in beauty and personal care, video drove 66.03% of Black Friday week GMV and LIVE 6.34%; collectibles was the exception, with LIVE at 34.81% of category GMV. “LIVE is dead” is therefore an overread; the more accurate statement is that the platform's overall sales were carried more by short video, while LIVE remains a primary channel in content-led categories such as collectibles.
Mechanically, Black Friday week pulls demand forward, short video can scale exposure without a scheduled session, and lower-priced items are easier to trigger through content, so units rise quickly; but FastMoss's weekly data shows co-movement, not proof that video content caused the increase. A competing explanation is that the platform added more brands and products in 2026 (Modern Retail notes that Best Buy, Ulta Beauty and Sephora are selling on TikTok Shop for their first holiday season), so the +65.7% run-up may partly come from supply expansion rather than stronger demand at the same shops. The two explanations have different implications: the first can be copied with content, the second can only be captured by taking share.
3. Why the platform's +65.7% cannot become your +65.7%
The first gap is seller and listing count. Platform units are a sum across all sellers; new brands, sellers and listings in 2026 raise the total even if an incumbent shop's units are flat. FastMoss does not disclose its panel size, seller or listing coverage, or a same-shop growth rate, so +65.7% is a market increase, not your same-shop increase.
The second gap is category and price band. Your category may be +31.4% (health) or +99.6% (menswear and underwear); your core price may be $79, while 71.9% of platform units are at $30 or less. When the platform's unit lift is led by low-price, high-frequency items, high-price, low-frequency items usually see a smaller unit increase but a higher contribution per unit; using the platform's unit lift to stock high-price goods overstates units and understates the cash tied up.
The third gap is the base period. The 2026 run-up is already 65.7% above the same weeks of 2025. If you treat that +65.7% as Black Friday week's year-over-year growth and add it on top of 2025 Black Friday week units, you double count. The correct order is: first calculate your own seasonal ratio R = 2025 Black Friday week units ÷ 2025 run-up weekly average; then multiply your 2026 run-up weekly average by R to get the “if the seasonal shape repeats” baseline; finally apply the pass-through k.
The platform's own figures cannot validate FastMoss either. Modern Retail reported on 20 October 2026 that TikTok Shop US's 2026 Black Friday–Cyber Monday campaign runs from 11 to 30 November; in the 2025 four-day weekend, TikTok Shop sales surpassed $500 million, and sellers hosting LIVE sessions saw 84% year-over-year sales growth across more than 760,000 sessions. The four-day “more than $500 million” and FastMoss's seven-day “$956.7 million estimate” are different windows; they can neither confirm nor refute each other, only show that the orders of magnitude are not contradictory.
The counter-case is a high-price, low-frequency item: the 71.9% of units at $30 or less describes the platform's unit mix, not your assortment; if you sell a $79 home or electronics item, the platform's +59.3% unit lift may correspond to a much smaller unit increase for you, and stocking on the low-price logic can tie up cash. A second counter-case is a LIVE-led category: if your sales come mainly from LIVE, the platform's “LIVE sessions with sales −11.6%” does not mean LIVE has failed; collectibles still had 34.81% of category GMV from LIVE. What matters is your own LIVE conversion, not the platform's session count.
4. A reproducible method: baseline reset, pass-through and two-week stock cover
This article converts the platform estimate into a shop range in three steps. First, calculate your own seasonal ratio R: R = 2025 Black Friday week units ÷ 2025 run-up weekly average. Second, calculate the 2026 Black Friday week baseline: baseline = 2026 run-up weekly average × R. Third, apply the pass-through k: forecast range = baseline × k, with k between 0.8 and 1.0. k is not an industry standard; it is a haircut for the mismatch between FastMoss's panel and your shop, 2026 supply expansion and category differences. The closer k is to 1, the more you believe your seasonal shape will repeat in full.
The analytical contribution is the conversion of a platform estimate into a shop range: use your own 2025 Black Friday week ÷ run-up weekly average to get R, then multiply your 2026 run-up weekly average by R and a pass-through k, so the platform's +65.7% is not added twice; then use Black Friday plus Cyber week stock cover and unit contribution to work back to affiliate and ad ceilings.
Stock must cover Black Friday week plus Cyber Monday week, not just Black Friday itself. FastMoss's 2025 Cyber Monday week (1–7 December) had 25,377,196 units, 85.3% of Black Friday week; so two-week demand = Black Friday week forecast × (1 + 0.853). The extra 10% buffer absorbs creator scheduling, inbound logistics and refund timing; 10% is an example, not an industry standard. Stock target = two-week demand × 1.10; gap = stock target − usable stock on hand − stock in transit.
Write the unit contribution formula in full: net contribution = price − purchase cost − platform fee − fulfilment/last mile − returns provision − affiliate commission − ad spend. The returns provision is a percentage of price, the platform fee applies to non-returned orders, and refunds and returns are not deducted twice; purchase cost must include goods and head freight, not gross margin alone. Maximum affiliate commission = price − purchase − platform fee − fulfilment − returns provision − ad spend − target net contribution; maximum ad spend = price − purchase − platform fee − fulfilment − returns provision − affiliate commission − target net contribution.
The pass-through k changes the stock plan directly. Using the two scenarios' baselines, moving k from 0.7 to 1.0 raises Scenario A's forecast from 8,167 to 11,667 units and Scenario B's from 1,008 to 1,440. The same platform data can produce stock ranges that differ by more than 40% because the shops' seasonal shapes differ. The table below is a sensitivity, not a forecast.
| Pass-through k | Scenario A forecast (units) | Scenario B forecast (units) |
|---|---|---|
| 0.7 | 8,167 | 1,008 |
| 0.8 | 9,333 | 1,152 |
| 0.9 | 10,500 | 1,296 |
| 1.0 | 11,667 | 1,440 |
Compared with applying the platform's +65.7% directly, the baseline-reset method gives 10,500 units in Scenario A; the direct method gives about 11,601 units, 1,101 units (+10.5%) more. In Scenario B it gives 1,224 units; the direct method gives about 1,989 units, 765 units (+62.5%) more. The error is larger for high-price, low-frequency goods because their seasonal shape differs more from the platform's low-price, high-frequency mix.
5. Two scenarios: low-price high-frequency versus high-price low-frequency
Every price, purchase cost, stock level, unit volume, commission and ad figure below is a labelled hypothetical, not any real shop's data; the 6% platform fee is an example and must be replaced with your contract. The calculation order is: first adjust revenue and refundable fees for the return rate, then list the net returns loss separately, and finally deduct affiliate commission and ads, so refunds and returns are not deducted twice.
Scenario A: $24.99 low-price, high-frequency, run-up already +66.7%
Hypothetical: 7,000 units in 2025 Black Friday week; 5,400 units in the two weeks of 27 October–9 November 2025 (2,700 per week); 9,000 units in the two weeks of 26 October–8 November 2026 (4,500 per week); pass-through k = 0.9; 17,000 usable units in stock; landed cost $9 per unit. By the formula, R = 7,000 ÷ 2,700 = 2.593; forecast = 4,500 × 2.593 × 0.9 = 10,500 units; the range is 8,167–11,667 units.
Unit economics: price $24.99, purchase $7.50, platform fee 6% = $1.50, fulfilment $4.00, returns provision 5% = $1.25, affiliate commission 15% = $3.75, ad spend $5.00; net contribution = 24.99 − 7.50 − 1.50 − 4.00 − 1.25 − 3.75 − 5.00 = $1.99. If ad spend rises to $7.00, net contribution is about $0; at $8.00 it is −$1.01. Break-even ad spend = 24.99 − 7.50 − 1.50 − 4.00 − 1.25 − 3.75 = $6.99; at $5.00 ad spend, break-even ROAS = 24.99 ÷ 5.00 = 5.00.
Two-week demand = 10,500 × 1.853 = 19,458 units; a 10% buffer gives 21,404 units; against 17,000 units in stock, the gap is 4,404 units, or $39,632 at $9 per unit.
Set the stock target at 19,000–21,500 units; cap affiliate commission at 15% and ad spend at $6.99 per order; if three consecutive days before 24 November run below 70% of forecast, or unit net contribution falls below $1.50, stop scaling. If k is 0.7, the forecast is 8,167 units and the two-week stock target is 16,647, below the 17,000 units on hand, so no replenishment is needed; set k before setting the order quantity, and do not treat the midpoint of the range as the default.
Scenario B: $79 high-price, low-frequency, the platform lift does not apply
Hypothetical: 1,200 units in 2025 Black Friday week; 250 units in the 2025 run-up week; 300 units in the 2026 run-up week; pass-through k = 0.85; 2,000 units in stock; landed cost $28 per unit. By the formula, R = 1,200 ÷ 250 = 4.8; forecast = 300 × 4.8 × 0.85 = 1,224 units; the range is 1,008–1,440 units.
Unit economics: price $79.00, purchase $28.00, platform fee 6% = $4.74, fulfilment $6.00, returns provision 8% = $6.32, affiliate commission 10% = $7.90, ad spend $18.00; net contribution = 79.00 − 28.00 − 4.74 − 6.00 − 6.32 − 7.90 − 18.00 = $8.04. Break-even ad spend = 79.00 − 28.00 − 4.74 − 6.00 − 6.32 − 7.90 = $26.04; at $18.00 ad spend, break-even ROAS = 79.00 ÷ 18.00 = 4.39.
Two-week demand = 1,224 × 1.853 = 2,268 units; a 10% buffer gives 2,495 units; against 2,000 units in stock, the gap is 495 units, or $13,861 at $28 per unit; applying the platform's +65.7% directly would give 1,989 units, 3,685 over two weeks and a 4,054-unit target, 1,559 units and $43,646 of cash above the baseline plan.
Replenish only about 500 units; do not expand to 2,000 units on the platform's +65.7%; put budget into short video first and add LIVE only where your own LIVE conversion beats video; if sell-through is below 60% by 1 December, stop replenishing and clear stock. At k = 0.7, the two-week target is 2,055 units, only 55 above the 2,000 units on hand; the roughly 500-unit replenishment corresponds to k ≈ 0.85, not every case.
The two scenarios do not conclude that the platform data is useful or useless. They show that the same platform lift is a restocking signal for a low-price, high-frequency shop and mainly a cash risk for a high-price, low-frequency shop; the first should get stock into the warehouse before 24 November, while the second should wait for clearer unit signals from pre-orders, add-to-carts and creator schedules.
6. Action list: what to pull this week, which window to watch and when to stop
This week, pull four windows: 27 October–9 November 2025, 24–30 November 2025, 1–7 December 2025 and 26 October–8 November 2026; by SKU × category × price band × channel, record units, GMV, refunds, stock and affiliate commission. Without these four windows, you cannot calculate R, and you cannot tell whether the platform's +65.7% is your growth.
- 1. Calculate R: 2025 Black Friday week units ÷ 2025 run-up weekly average; then calculate the 2026 run-up weekly average and the baseline = 2026 run-up weekly × R.
- 2. Set k: k = 0.8–1.0. Use the low end if the 2026 run-up growth came mainly from new sellers or listings, or if your category is outside the platform's top ten; use the high end if your same-shop growth matches the platform. k is not an industry standard; record the realised value after the event.
- 3. Calculate stock: two-week demand = Black Friday week forecast × 1.853; stock target = two-week demand × 1.10; gap = stock target − usable stock − stock in transit.
- 4. Calculate contribution: net contribution = price − purchase − platform fee − fulfilment − returns provision − affiliate commission − ad spend; solve the break-even ad and commission before adding creators.
- 5. Split channels: look at short video and LIVE separately. Platform-wide LIVE sessions with sales fell 11.6%, but collectibles still had 34.81% of category GMV from LIVE; do not let one platform total set your channel budget.
- 6. Set stop conditions: three consecutive days below 70% of forecast before 24 November, unit net contribution below target, or sell-through below 60% by 1 December means pause scaling or replenishment and preserve cash.
Further reading on this site: for the data definitions behind contribution, returns and stock cover, see Data Methodology; for TikTok attribution and creator-commission analysis, see TikTok Data Analysis; for more reports, see the cross-border e-commerce reports centre.
7. Counter-cases, limits and bottom line
Counter-case one: if the 2026 run-up's +65.7% came mainly from new sellers and listings while your same-shop units were flat, the platform increase is not a demand signal for you but a share pressure; stocking on the platform lift would overstate demand. Counter-case two: if your item is a $79 high-price, low-frequency product, the platform's 71.9% of units at $30 or less does not match your customer; unit growth will be much lower than the platform's, and stocking on the platform's unit lift would tie up cash. Counter-case three: if your sales come mainly from LIVE, the platform's LIVE sessions with sales −11.6% does not mean LIVE has failed; collectibles still had 34.81% of category GMV from LIVE, so look at your own LIVE conversion.
The biggest unknowns are how much FastMoss's panel overlaps with your shop and what 2026 Black Friday week demand will actually be; a platform estimate can give direction but cannot replace your own pre-orders, add-to-carts, creator schedule and stock data. Other limits: FastMoss does not disclose its panel size, product coverage, confidence intervals or GMV model; the platform has no comparable official weekly unit or GMV series; the week of 9–15 November 2026 is missing; Black Friday week 2025 may be an unusually high base; price-band shares are not GMV shares; the four-day platform window and the seven-day FastMoss window do not align; no customer or shop data is used.
Evidence that would change the conclusion: your own 2026 run-up growth is below +20%; your category's Black Friday week lift is below 30%; your sell-through before 1 December is below 60%; FastMoss revises its 2025 or 2026 data; TikTok changes the campaign window, fee or LIVE rules; or your cash flow cannot cover the stock gap. In any of those cases, return to R, k and the stock formula rather than reusing the examples.
Bottom line: FastMoss's 29.7 million units, $956.7 million and +65.7% are useful direction for understanding TikTok Shop US Black Friday demand, but they are not a forecast for your shop. The executable approach is: use your own 2025 Black Friday week ÷ run-up weekly average to get R, then 2026 run-up weekly × R × k to get a stock range; use Black Friday plus Cyber week stock cover and unit contribution to work back to affiliate and ad ceilings; a low-price, high-frequency shop can stock toward the upper half of the range before 24 November, while a high-price, low-frequency shop should replenish only the roughly 500 units with the clearest signal. Every scenario number is hypothetical and must be replaced with your actual contract rates and stock.
Sources
- 1. FastMoss, “TikTok Shop Black Friday Statistics 2026: 12 Numbers to Know” (primary data source, 17 November 2026): original, accessed 19 November 2026.
- 2. Modern Retail, “Brands Briefing: How brands are gearing up for TikTok Shop's biggest holiday season yet” (secondary report, 20 October 2026): original, accessed 19 November 2026.
Data basis: the 29,746,408 Black Friday week units, $956.7 million GMV estimate, 21,910,029 units and $455.5 million in the 2024 week, 48,448,581 units versus 29,234,358 in the 2025 run-up, 25,377,196 Cyber Monday week units, category and price-band shares, 1,542,999 videos with sales and 59,190 LIVE sessions with sales all come from FastMoss's 17 November 2026 article and its S1–S3 data notes; the $32.16 and $20.79 implied GMV per unit are this article's division of the two estimates, and if coverage differs they are directional only. The TikTok Shop 2026 campaign window of 11–30 November, the 2025 four-day weekend's more than $500 million, more than 760,000 LIVE sessions and +84% year-over-year LIVE sales come from TikTok's press release as reported by Modern Retail on 20 October 2026; the four-day and seven-day windows do not align. The scenarios' units, stock, prices, purchase costs, platform fees, fulfilment, returns provisions, affiliate commissions, ad spend and landed costs are labelled hypotheticals, not real shop data; the 6% platform fee, 10% buffer and 0.8–1.0 pass-through are examples, not industry standards. All amounts are in US dollars with no currency conversion.
This article was prepared with the assistance of an automated research workflow and is based on the public sources listed at the end; it has not been reviewed by a human editor.