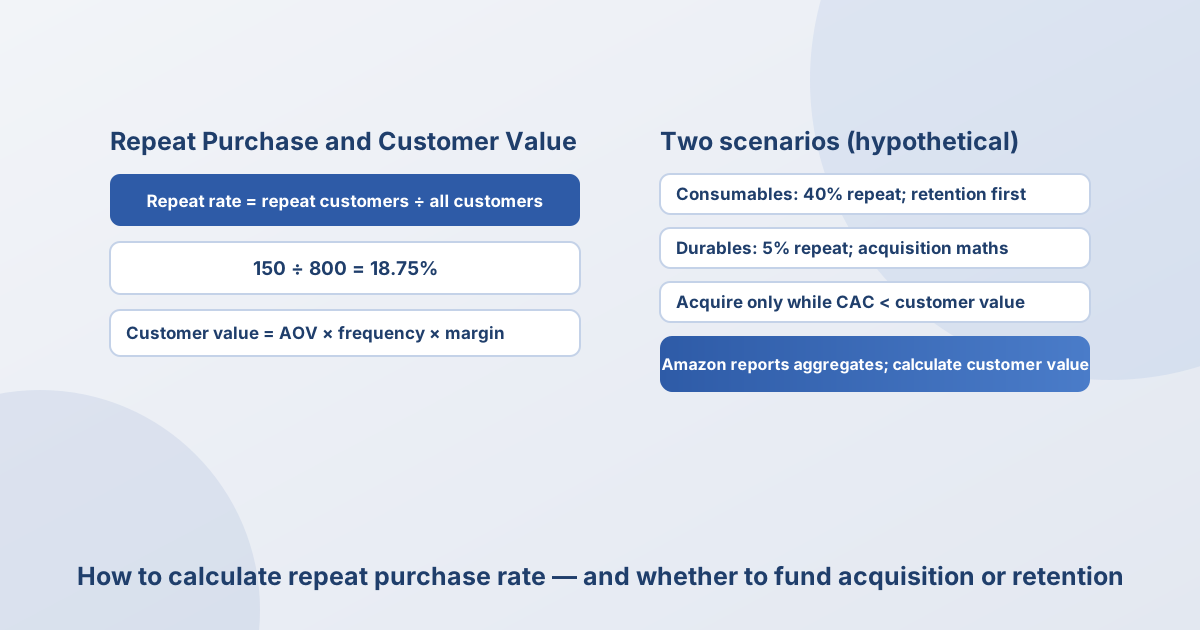
For a cross-border seller already generating orders on Amazon or another marketplace, the real question is whether growth should come from acquiring new customers or from getting existing customers to buy again. The answer is to calculate your own repeat-purchase rate and customer value first, then compare them with acquisition cost: when the average contribution margin per customer is clearly above customer acquisition cost (CAC), acquisition pays; when repeat purchasing is already strong and acquisition cost is close to or above customer value, the budget should shift toward retention. This article uses Amazon Brand Analytics' Repeat Purchase Behavior and Customer Loyalty Analytics to set out the formulas and two scenarios. Every order count, customer count, average order value, margin and ad-spend figure below is an explicitly labelled hypothetical example.
1. Define the metric first: repeat-order share, repeat-customer rate and customer value are not the same thing
Repeat purchase rate has several definitions, and using the wrong one can reverse the conclusion. This article separates three common measures: repeat-order share = repeat orders ÷ total orders; repeat-customer rate = customers with two or more purchases ÷ total purchasing customers; average purchase frequency = total orders ÷ total customers. They answer different questions: the first shows how much of turnover comes from returning customers, the second shows what share of customers come back, and the third shows how many times the average customer buys.
| Metric | Definition / formula | Question it answers |
|---|---|---|
| Repeat-order share | Repeat orders ÷ total orders | How much of turnover comes from returning customers |
| Repeat-customer rate (repeat rate) | Customers with two or more purchases ÷ total purchasing customers | What share of customers buy again |
| Average purchase frequency | Total orders ÷ total customers | How many orders the average customer places |
| Average contribution margin per customer | Average order value × purchase frequency × contribution margin rate | How much margin one customer contributes on average |
Why customer value matters: CAC is a one-off investment, and the business only works if a customer buys repeatedly over their lifecycle and the cumulative contribution margin exceeds that acquisition cost. Amazon's Customer Loyalty Analytics dashboard is explicitly framed around increasing customer lifetime value: it lets brands create customer segments, analyse purchase patterns, identify and reward the most valuable customers, contact customers who have not purchased for a while, and surface recommendations for programmes such as Brand Tailored Promotions.
2. Where the official data comes from: Amazon Brand Analytics
Amazon Brand Analytics (accessed 19 November 2026) is a Seller Central tool that lets brands review aggregate customer data. It is organised into four dashboard groups: Customer Journey Analytics, Customer Loyalty Analytics, Search Analytics and Consumer Behavior Analytics. The dashboard that directly addresses repeat purchasing is Repeat Purchase Behavior, which Amazon says provides a detailed breakdown of how often customers repeatedly buy from your brand. It tracks orders received, sales from repeat purchases and the number of repeat customers.
Customer Loyalty Analytics focuses on retention and customer value. Amazon describes it as a way to boost customer lifetime value and optimise engagement: create customer segments and analyse purchase patterns, identify and reward the most valuable customers, contact customers who have not bought in a while, and get recommendations for programmes such as Brand Tailored Promotions. Two neighbouring dashboards help interpret the numbers: Demographics breaks sales down by age, income, education, gender and marital status, and Market Basket Analysis shows which products customers often buy together.
Check access before relying on it: Brand Analytics requires a Professional selling account ($39.99 per month plus selling fees), enrolment in Amazon Brand Registry and the Brand Representative role. Definitions also do not travel unchanged across platforms. Shopee's Business Insights has seven modules — Overview, Product, Sales, Services, Traffic, Marketing and Selling Coach — and its Overview shows sales, orders, conversion rate, visitors, page views and change from the previous day, but it does not expose a field with the same name and definition as Amazon's repeat-purchase rate. Use each marketplace's own seller centre definitions rather than applying Amazon's formula to Shopee.
3. Mechanism: how repeat purchasing dilutes acquisition cost — and when it does not
Repeat purchasing spreads acquisition cost over more orders, which is the direct value of retention: the same customer's second and third orders do not require another acquisition fee. The known mechanism is that as long as customer value (average order value × purchase frequency × contribution margin rate) exceeds CAC, acquisition has positive unit economics; the higher the repeat rate and frequency, the larger customer value and the higher the CAC the business can absorb. This turns "new customers or old customers" into an inequality: customer value > CAC means keep acquiring; customer value ≤ CAC means shift to retention or organic traffic.
Counter-cases and alternative explanations
Two counter-cases are easy to misread. First, a high repeat rate does not prove brand loyalty: high-frequency consumables such as paper goods, pet food and beauty naturally repurchase often, which may reflect the category rather than superior brand work; low repeat rates for durable goods such as furniture and major appliances are normal and do not by themselves show operational failure. To distinguish, look at the composition of repeat purchases — whether the same cohort keeps buying, or whether the repeat purchases are occasional and driven by new launches or promotions; only the former is a reusable asset. Second, high customer value may come from a high average order value rather than frequent repurchase; only by separating AOV, frequency and margin can you tell whether to raise price, raise frequency or cut cost.
4. A recalculable analysis: turning repeat data into an acquisition-versus-retention choice
Take an Amazon store run by a beauty brand over a 90-day window (hypothetical example): 1,000 total orders, of which 250 are repeat orders; 800 total purchasing customers, of which 150 are repeat customers (two or more purchases); an average order value of $30; a 25% contribution margin (after purchase cost, marketplace commission, fulfilment and return losses, with no double deduction); $4,500 of ad spend in the 90 days, generating 600 new customers.
Step by step: repeat-order share = 250 ÷ 1,000 = 25%; repeat-customer rate = 150 ÷ 800 = 18.75%; average purchase frequency = 1,000 ÷ 800 = 1.25 orders per customer; average contribution margin per customer = $30 × 1.25 × 25% = $9.375; CAC = $4,500 ÷ 600 = $7.50 per new customer. Conclusion: CAC of $7.50 is slightly below the $9.375 average contribution margin per customer, so acquisition breaks even with a small surplus, but the cushion is thin: once CAC rises above $9.375, or customer value falls below $7.50, acquisition turns negative.
The conclusion is sensitive to two inputs. If the repeat-customer rate rises from 18.75% to 30% (240 repeat customers) and average purchase frequency rises to 1.35 orders per customer (hypothetical example), average contribution margin per customer = 30 × 1.35 × 25% = $10.13, widening the room for acquisition; if CAC rises to $12 because of ad auction pressure, then $9.375 < $12, acquisition turns loss-making and the budget should move toward retention and organic traffic. The key question is therefore not "what repeat rate is good" but "can your customer value cover your acquisition cost".
5. Two scenarios: high-frequency consumables and low-frequency durables
Scenario A: high-frequency consumables, retention first. Assume a pet-food brand in a naturally high-frequency category, with a 40% 90-day repeat-customer rate, 2.0 orders per customer, a $25 average order value and a 20% contribution margin. Average contribution margin per customer = 25 × 2.0 × 20% = $10. If CAC is $8, acquisition still leaves $2 per customer, and high repeat purchasing means existing customers contribute reliably, so the brand should prioritise retention — subscriptions, bundle offers and multi-packs — to push frequency above 2.0 rather than relying mainly on acquisition.
Scenario B: low-frequency durables, acquisition first but only with the maths. Assume a furniture brand with only a 5% 90-day repeat-customer rate, 1.05 orders per customer, a $120 average order value and a 25% contribution margin. Average contribution margin per customer = 120 × 1.05 × 25% = $31.50. If CAC is $25, acquisition is still positive ($31.50 > $25), but because there is almost no repeat purchase, each customer contributes once and the business depends heavily on continuous acquisition — the better moves are to extend the range into accessories or consumables that create a repeat occasion, or to lower CAC, rather than assuming furniture buyers will suddenly repurchase often.
6. Execution checklist and stop conditions
Start with a monthly or 90-day table recording total orders, repeat orders, total customers, repeat customers, average order value, contribution margin, ad spend and new customers, then calculate repeat-customer rate, purchase frequency, average contribution margin per customer and CAC. Use the gap between customer value and CAC to set the budget direction.
- Observation window: at least one full quarter (90 days), to avoid misreading a single promotional month or seasonality.
- Cohorts: group customers by first-order month and check whether the same cohorts buy again over time, rather than looking only at a blended repeat rate.
- Continue condition: increase acquisition spend only while average contribution margin per customer stays above CAC and the repeat-customer rate is rising.
- Stop condition: if CAC exceeds average contribution margin per customer for two consecutive windows, or the repeat-customer rate keeps falling, pause acquisition and shift to retention and organic traffic.
- Threshold note: the break-even point and the 40%/5% repeat rates are hypothetical examples, not industry standards; replace them with your own data.
7. Limitations and uncertainty
Three unknowns are most likely to change the conclusion. First, Brand Analytics reports aggregate customer data, not individual customers, so it cannot produce a true customer-level LTV cohort. Second, a single benchmark is unlikely to transfer across categories: the rate varies by category, price band and season, and an external benchmark can mislead. Third, average contribution margin per customer is approximated with a fixed average order value, frequency and margin; a real LTV would need to account for time decay, post-return resale and discounts, whereas this article uses a static 90-day approximation. What would update the judgement: once you read your own Repeat Purchase Behavior and Customer Loyalty Analytics figures in Seller Central, replace the hypothetical inputs and recalculate; if you can build 6–12 month cohorts, you can turn "will the repeat rate persist" from an assumption into evidence.
Update note (19 November 2026): when the English edition was published, the Chinese and English texts were corrected to state the exact break-even condition — acquisition turns negative only when CAC exceeds $9.375 or customer value falls below $7.50 — and to narrow the benchmark claim to the difficulty of transferring a single benchmark across categories. The original Chinese publication date is unchanged.
Method and notes
Data basis: Amazon Brand Analytics' Repeat Purchase Behavior (orders received, sales from repeat purchases and number of repeat customers), Customer Loyalty Analytics (customer lifetime value, customer segments, rewarding high-value customers, contacting dormant customers and Brand Tailored Promotions recommendations), Demographics (age, income, education, gender and marital status) and Market Basket Analysis (products often bought together) come from Amazon's US public page (accessed 19 November 2026); the seven Shopee Business Insights modules come from Shopee's seller education page (accessed 18 November 2026). Every order count, customer count, average order value, contribution margin, ad-spend, CAC and repeat-rate figure in this article is an explicitly labelled hypothetical example, not a statistic from any platform or shop; nothing here implies that Nuozhou Digital Intelligence provides real-time sales or back-end data for any platform.
The increment in this article is that it connects what Amazon officially reports with the seller's "acquire or retain" decision through one recalculable inequality, rather than offering the generic advice to "improve repeat purchases".
For the wider measurement framework, see Amazon data analysis and e-commerce data analysis; our data methodology page explains how we separate platform-reported data, estimates and hypothetical examples. For the full profit calculation and advertising break-even method, those English topic pages provide the same measurement logic.
This article was prepared with the assistance of an automated research workflow and is based on the public sources listed at the end; it has not been reviewed by a human editor.
Sources
- 1. Amazon, Brand Analytics (primary source; four dashboard groups, Repeat Purchase Behavior's orders received, sales from repeat purchases and repeat customers, Customer Loyalty Analytics' lifetime-value and segmentation capabilities, Demographics, Market Basket Analysis, the Professional plan and Brand Registry requirements): accessed 19 November 2026. Published date not stated.
- 2. Shopee SG Seller Education Hub, What is Business Insights (primary source; the seven Business Insights modules and Overview's sales, orders, conversion rate, visitors and page views): page dated 9 June 2025, accessed 18 November 2026.