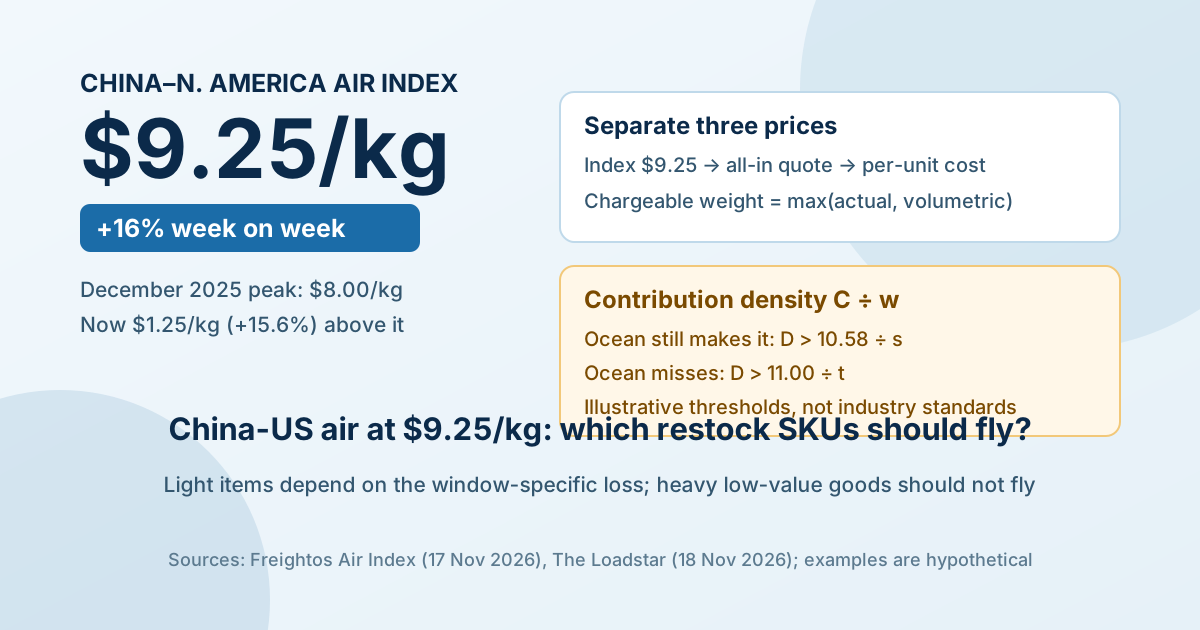
If you ship from China to the US and are deciding whether to fly replenishment stock for Black Friday, Cyber Monday or December, the short answer is: do not treat $9.25/kg as your cost, and do not treat "above last year's peak" as a reason to fly. Under the rule below, only SKUs whose unit contribution divided by chargeable weight is high enough — and whose sales would be lost without air — justify the premium; heavy, low-value SKUs should stay on ocean even if they stock out. As of 19 November, air mainly protects Cyber Monday (30 November) and December; Black Friday (27 November) is reachable only if door-to-door transit is close to five days.
If you ship from China to the US and are deciding whether to fly stock for Black Friday, Cyber Monday or December, the question is not whether $9.25/kg is high. It is whether each SKU's unit contribution divided by chargeable weight can cover the air premium over ocean, or, when ocean cannot reach the window at all, the full air cost.
Separate three prices: the index, the forwarder's all-in quote and your per-unit cost
Freightos's update of 17 November 2026 is explicit: the China–North America air index rose 16% in a week to $9.25/kg, already above the $8.00/kg peak that did not arrive until December 2025; the transatlantic lane rose 12% to $3.27/kg, its highest since December 2022. The number matters, but it is only an index.
The Freightos index is an all-in airport-to-airport spot rate for general cargo, published in 100–300 kg, 300–1,000 kg and 1,000–3,000 kg weight breaks; it is not your forwarder's quote and does not include origin handling, export clearance, destination handling, delivery or the forwarder's margin.
Three adjustments turn the index into your cost. First, the forwarder's all-in quote: origin handling, export clearance, screening, destination handling, delivery, brokerage and margin are added. If the quote is $11.00/kg, the $9.25 index explains $9.25 of it; the other $1.75 (+18.9%) sits outside the index. Second, chargeable weight: air charges the greater of actual and volumetric weight, usually length × width × height in centimetres ÷ 6,000, or ÷ 5,000 on some express services. A 30 × 20 × 15 cm box cubes to 1.5 kg even if it weighs 0.8 kg. Third, per-unit cost: chargeable weight × all-in rate.
Table 1 converts common chargeable weights into per-unit costs. Ocean is allocated at $0.42/kg ($8,460/FEU ÷ 20,000 kg ≈ $0.423, rounded), for comparison only and excluding terminal charges at both ends.
| Chargeable weight/unit | Air at $11.00/kg | Ocean at $0.42/kg | Air premium over ocean |
|---|---|---|---|
| 0.05 kg | $0.55 | $0.02 | $0.53 |
| 0.15 kg | $1.65 | $0.06 | $1.59 |
| 0.30 kg | $3.30 | $0.13 | $3.17 |
| 0.50 kg | $5.50 | $0.21 | $5.29 |
| 1.00 kg | $11.00 | $0.42 | $10.58 |
| 1.50 kg | $16.50 | $0.63 | $15.87 |
| 2.00 kg | $22.00 | $0.84 | $21.16 |
The table invites the obvious question: if ocean is so much cheaper, why fly at all? Because ocean cannot buy shelf space this week. The next section separates what is known about the rate move from what is attribution.
How fast it moved, why, and which explanations do not hold
The size of the move is not in dispute: $7.76/kg on 3 November (+9% week on week) to $9.25/kg on 17 November (+16%) is +$1.49/kg, or +19.2% over two weeks, and 15.6% — or $1.25/kg — above the $8.00/kg peak of December 2025.
The cause needs separating. Freightos says the increase happened before the 13 November US air-traffic-control failure and did not accelerate after it; The Loadstar quotes Transport Intelligence's Thomas Cullen saying the operational impact was "remarkably little". Calling $9.25/kg an outage surcharge is wrong; the outage created specific flight delays, but it was not the driver.
Freightos attributes the tightness to peak volumes layered on already-elevated demand and space absorbed by data-centre buildouts. That is the index provider's attribution, not a decomposition; it explains direction, not next week's print. Forwarder News puts it more simply: the market is short of space, not cargo, and the Christmas rush has not arrived; it expects China–North America to stay above $8.00/kg until mid-December — a forecast, not a fact.
Lane dispersion is the other boundary. ExFreight data cited by The Loadstar show Asia–US above 100 kg averaging $8.63/kg in November, +10% from $7.81 in June, but country lanes ranged from South Korea +64%, Indonesia +53%, Hong Kong +34%, Japan +28%, China +21% and Malaysia +14% to India −17%, Sri Lanka −14% and Taiwan −7%. A +16% China–North America print is not +16% for every origin, and it is not your 100–300 kg quote.
Supply offers counter-evidence too. Cathay Cargo's October tonnage rose 8% year on year while available freight tonne-kilometres rose only 1%, a sign that demand outpaced capacity; but that is one carrier, not the market. Capacity can also return: Freightos notes winter schedules and freighters shifting to higher-volume lanes, both of which affect specific lane prices.
On the ocean side, Freightos put the US West Coast at $8,460/FEU and the US East Coast at $9,850/FEU on 17 November, with Asia–North Europe at about $3,400/FEU and Asia–Mediterranean at $4,300/FEU. Asia–Europe rates are still 40%–50% above a year earlier, but the Red Sea return and fleet growth raise the chance of overcapacity and lower rates next year. Allocating $8,460 over 20,000 kg gives $0.42/kg; over 26,000 kg, $0.33/kg. The East Coast figure is $0.49/kg at 20,000 kg and $0.38/kg at 26,000 kg. A light shipment that cubes out at 12,000 kg gives $0.71–$0.82/kg. At 20,000 kg, the $9.25 index is about 22 times the ocean allocation, and an $11.00 all-in quote about 26 times.
The decision rule: contribution density (C/w) and two thresholds
Three inputs turn "fly or not" into a ranking: unit contribution C, chargeable weight per unit w, and the all-in air rate R_air versus the ocean allocation R_ocean.
Define C as price minus purchase cost, platform commission, fulfilment and last-mile, advertising and a returns provision. It excludes head freight, because head freight is what is being compared. If C omits advertising or returns, contribution density is overstated and the answer tilts toward flying.
Air freight buys time: chargeable weight multiplied by the all-in rate gives the per-unit air cost, and flying is justified only when the contribution it protects is larger than that cost.
Contribution density D = C ÷ w, in dollars of contribution per chargeable kilogram. The higher D, the more contribution each kilogram of air capacity carries. Then split by timing:
Case one: ocean can still reach the sales window, just later. Air costs an extra w × (R_air − R_ocean) per unit. Flying is justified only if the contribution protected by the window-specific loss share s, s × C, exceeds that premium. The threshold is D > (R_air − R_ocean) ÷ s. At R_air = $11.00 and R_ocean = $0.42, it is 10.58 ÷ s: $35.3/kg at s = 30%, $26.4/kg at 40% and $10.6/kg at 100%.
Case two: ocean cannot reach the window, so the alternative is not to sell. Air must cover its full cost w × R_air. The threshold is D > R_air ÷ t, where t is expected sell-through and unsold units are assumed to recover zero contribution: $15.7/kg at t = 70%, $22.0/kg at 50% and $27.5/kg at 40%.
This article turns "air or ocean" from a rate comparison into two thresholds: when ocean can still reach the window, contribution density must cover the air-over-ocean premium divided by the window-specific loss share; when ocean cannot, it must cover the full air cost divided by expected sell-through.
This is the article's decision tool, not an industry standard; s and t must come from your own history. Its value is that the same SKU is screened twice — first on whether ocean can reach the window, then on the matching threshold — so a higher index does not automatically become "fly everything".
| Case | Threshold | Example at an $11.00/kg all-in quote |
|---|---|---|
| Ocean still reaches the window; window-specific loss share s | D > 10.58 ÷ s | s = 30% → $35.3/kg; s = 40% → $26.4/kg |
| Ocean misses the window; expected sell-through t | D > 11.00 ÷ t | t = 70% → $15.7/kg; t = 50% → $22.0/kg |
Three scenarios: same $9.25/kg, one should fly, one should not, one depends on sell-through
Every price, contribution, weight, order quantity and sell-through rate below is a labelled hypothetical, not any real store's data. The arithmetic covers the head-freight difference only; tariffs, marketplace storage and last-mile surcharges are excluded.
Scenario A: 0.20 kg light item, the loss share decides
Hypothetical: 0.20 kg chargeable weight, $7.00 unit contribution, $11.00/kg all-in air, $0.42/kg ocean allocation, 2,000 units flown; part of this stock sells only in the Black Friday–Cyber Monday window, and ocean would not arrive until mid-December.
Air is $2.20/unit, ocean $0.084, so the premium is $2.116/unit and $4,232 in total; the break-even window-specific loss share is 30.2%. If 40% of the flown units would be lost without air, protected contribution is $5,600 and net benefit is $1,368; at 30%, protected contribution is $4,200 and the result is a $32 loss.
Fly only if the sales data support a window-specific loss share above 30%; otherwise keep the 2,000 units on ocean and fly at most a small test batch.
Scenario B: 1.50 kg heavy item, do not fly even if it stocks out
Hypothetical: 1.50 kg chargeable weight, $9.00 unit contribution, $11.00/kg all-in air, $0.42/kg ocean allocation, 500 units flown; the goods are already produced and the purchase cost is sunk, and even a full stockout would not justify any replenishment other than ocean.
Air is $16.50/unit, already above the $9.00 unit contribution; every flown unit loses $7.50, and 500 units lose $3,750. Even when the goods are already produced and the only alternative is to leave them unsold, air does not recover its cost.
Keep it on ocean; handle a stockout with a substitute SKU, pre-order or delayed shipping, and do not put heavy, low-value SKUs on a plane. Re-evaluate only for an urgent part whose unit contribution exceeds $16.50.
Scenario C: 0.50 kg new item, ocean misses the window
Hypothetical: 0.50 kg chargeable weight, $12.00 unit contribution, $11.00/kg all-in air, 800 units flown; ocean cannot reach the December window, the alternative is not to sell, and unsold stock is assumed to recover zero contribution.
Air is $5.50/unit and the break-even sell-through is 45.8%. At 70% sell-through, net contribution is $8.40 − $5.50 = $2.90/unit, or $2,320 on 800 units; at 40%, it is $4.80 − $5.50 = −$0.70/unit, a $560 loss.
Fly only if forecast sell-through is above 46% and unsold stock can be cleared at a low price without a further loss; if the evidence is thin, fly a small batch first and leave the rest for the next flight or ocean.
Together the three cases do not say "air is good" or "air is bad". They say: light, high-D SKUs with a large window-specific loss can fly; heavy, low-value SKUs should not; a new item that ocean cannot deliver in time should fly only if sell-through clears the air-cost line.
The quote moves the threshold. In Scenario A, a $10.00/kg quote lowers s* from 30.2% to 27.4%; a $12.50/kg quote raises it to 34.5% and cuts the net benefit at a 40% loss from $1,368 to $768. In Scenario C, $12.50/kg raises t* from 45.8% to 52.1% and cuts the net benefit at 70% sell-through from $2,320 to $1,720. Get the written quote before deciding; do not substitute the index for it.
The calendar: what air can still catch if you book today
In 2026, Black Friday is 27 November and Cyber Monday is 30 November. With a 5–8 day door-to-door assumption (an example; replace it with your forwarder's transit time), a booking on 19 November lands at the earliest on 24–27 November: Black Friday is the edge case, Cyber Monday is more realistic, and December is the main window.
That has two consequences. First, if the goal is the Black Friday opening, air is already late; flying now protects Cyber Monday and December, not sessions that have started. Second, on normal trans-Pacific transit times, an ocean container cannot reach Black Friday or Cyber Monday; it is more likely to serve January replenishment (check your sailing schedule). Treating air and ocean as an either/or for the same batch misses the usual answer: fly a small urgent tranche, keep the bulk on ocean.
Inbound appointment cut-offs and warehouse receiving dates vary by platform, marketplace and warehouse; check them in the seller centre before booking, or the cargo will arrive without a slot.
Action list for this week
This week, pull 90 days of SKU data: chargeable weight (the greater of packed length × width × height ÷ 6,000 and actual weight), unit contribution (price minus purchase cost, platform commission, fulfilment, advertising and returns provision), the remaining sales window and the fallback if the SKU stocks out. Then get two or three airport-to-door all-in quotes and check origin handling, export clearance, destination handling, delivery and quote validity line by line.
- 1. Pull data: for the last 90 days, by SKU and marketplace, record price, purchase cost, commission, fulfilment, advertising, returns, chargeable weight, average daily sales, the sell-through curve and current days of cover.
- 2. Compute D = C ÷ w and rank SKUs from high to low; start with the top 10–20 by D, not with the highest-value or most urgent item.
- 3. Set s or t: use last year's Black Friday–Cyber Monday and December sell-through curves to estimate the share that would be lost without air; if there is no history, test a small batch rather than assuming 100%.
- 4. Get quotes: two or three forwarders, airport-to-door all-in, itemising origin handling, export clearance, screening, destination handling, delivery, validity and how fuel and security charges are calculated; put the quote next to the FAX index.
- 5. Split the shipment: fly only the gap that covers the window and keep the rest on ocean; prioritise high-D, light, seasonal SKUs that cannot be substituted after a stockout.
- 6. Set stop conditions: if the written quote exceeds your cap (for example $12.50/kg), s falls below break-even, sell-through is below 46%, or the rate falls back below $8.00/kg before booking, recalculate rather than fly.
Further reading on this site: for the data definitions behind contribution, chargeable weight and sell-through, see Data Methodology; for Amazon-specific analysis, see Amazon Data Analysis; for more reports, see the cross-border e-commerce reports centre.
Counter-cases, limits and what would overturn this conclusion
The counter-case is a rate reversal after booking: if you fly non-urgent goods because you fear another increase and rates fall back below $8/kg in December, you have paid a time premium you did not need.
The second counter-case is that your quote is not the index. At $9.50/kg all-in, Scenario A's s* falls to 25.9%; at $12.50, it rises to 34.5%. The index gives direction; the quote sets your threshold.
The third is that ocean may actually make the window. If sailing schedules, port and inbound appointments allow ocean to arrive before the window, use the case-one threshold, not the full-cost threshold; the same SKU can move from "do not fly" to "fly". That is not semantics; it is the order of the question — timing first, money second.
The biggest unknowns are how many sales would be lost without air and how many days air cargo actually takes door to door; only your own sell-through history, the platform's inbound appointment calendar and your forwarder's transit time can estimate them, not the index.
Other limits: the FAX is a general-cargo, airport-to-airport index that excludes terminal charges, duties and storage; different weight breaks, airports and commodities (batteries, oversize, temperature-controlled) can price well above it; the data-centre demand explanation is Freightos's attribution; Cathay is one carrier; Forwarder News's "above $8 until mid-December" is a forecast; unsold units are assumed to recover zero contribution, and any liquidation recovery lowers the threshold; no customer or store data is used.
Evidence that would change the answer: a written all-in quote below $10.00/kg; your own history showing s below 30%; a new item's sell-through below 46%; a platform extension of the sales window or inbound cut-off; or rates falling below $8.00/kg before booking. In any of those cases, return to the threshold formula rather than reusing the examples.
Bottom line
$9.25/kg is an index above the 2025 peak, not your quote and not a signal to switch everything to air. For a China-to-US seller this week: compute C ÷ w; if ocean can still reach the window, use 10.58 ÷ s; if it cannot, use 11.00 ÷ t; fly only the high-D, light, seasonal units that cover the window gap; keep heavy, low-value SKUs on ocean. A booking today mainly protects Cyber Monday and December; Black Friday is reachable only at the fast end of transit.
Sources
- 1. Freightos, "US air cargo recovering from outage; new US-CN tensions ahead of talks – November 17, 2026 Update" (primary, 17 November 2026): original, accessed 19 November 2026.
- 2. Freightos, "Asia – US air rates already nearing last year's high on peak season volumes – November 3, 2026 Update" (primary, 3 November 2026): original, accessed 19 November 2026.
- 3. Freightos, "Freightos Air Index (FAX): Global Air Cargo Price Index" (primary, methodology page, undated): original, accessed 19 November 2026.
- 4. The Loadstar, "Transatlantic airfreight rates at highest level for four years" (secondary, 18 November 2026): original, accessed 19 November 2026.
- 5. Forwarder News, "China-US air passes last year's peak a month early" (secondary, 18 November 2026): original, accessed 19 November 2026.
Data basis: the China–North America air index of $9.25/kg, the 16% week-on-week change, the $3.27/kg transatlantic rate, the December 2025 peak of $8.00/kg and the ocean rates of $8,460/FEU to the US West Coast and $9,850/FEU to the US East Coast come from Freightos's weekly update of 17 November 2026; the $7.76/kg reading of 3 November comes from Freightos's update of the same date, and the two-week change is the arithmetic difference between those two updates; the Asia–US above-100 kg rate of $8.63/kg, the Europe–US rate of $3.83/kg and the country-level changes come from ExFreight data cited by The Loadstar on 18 November 2026; the FAX definition of an all-in, airport-to-airport spot rate in 100–300 kg, 300–1,000 kg and 1,000–3,000 kg weight breaks comes from Freightos's Air Index methodology page. The $11.00/kg all-in quote, 20,000 kg payload, 5–8 day door-to-door transit, selling prices, unit contributions, order quantities and sell-through rates are explicitly labelled hypothetical examples, not any real store's or forwarder's data; the ocean cost per kilogram is calculated here as $8,460/FEU ÷ 20,000 kg ≈ $0.423, rounded to $0.42 in the scenarios, and excludes origin and destination terminal charges, drayage and duties; all amounts stay in US dollars and are not converted.
This article was prepared with the assistance of an automated research workflow and is based on the public sources listed at the end; it has not been reviewed by a human editor.