Industry Analysis
End-to-end category intelligence for cross-border decisions.
Built around seven layers: market size, top brands, top stores, top products, subcategory structure, custom market, and attribute analysis. Keep teams aligned under one data language.
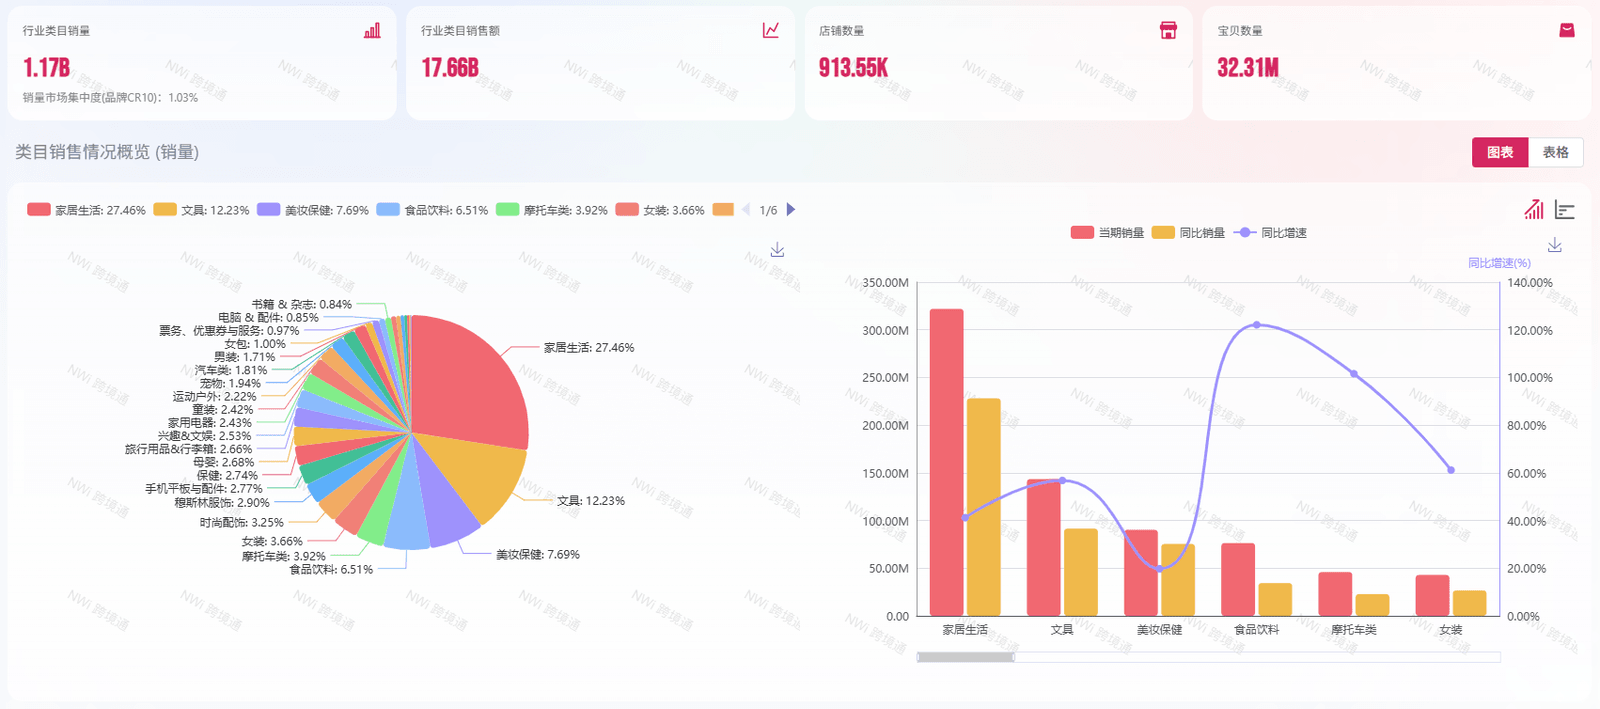
Read volume, structure, and trend in one place
Quickly assess category volume, sales value, store scale, and structural composition, then combine trend curves to build a consistent view of market momentum.
Use platform/site filters to review category scale and stage-level changes quickly.
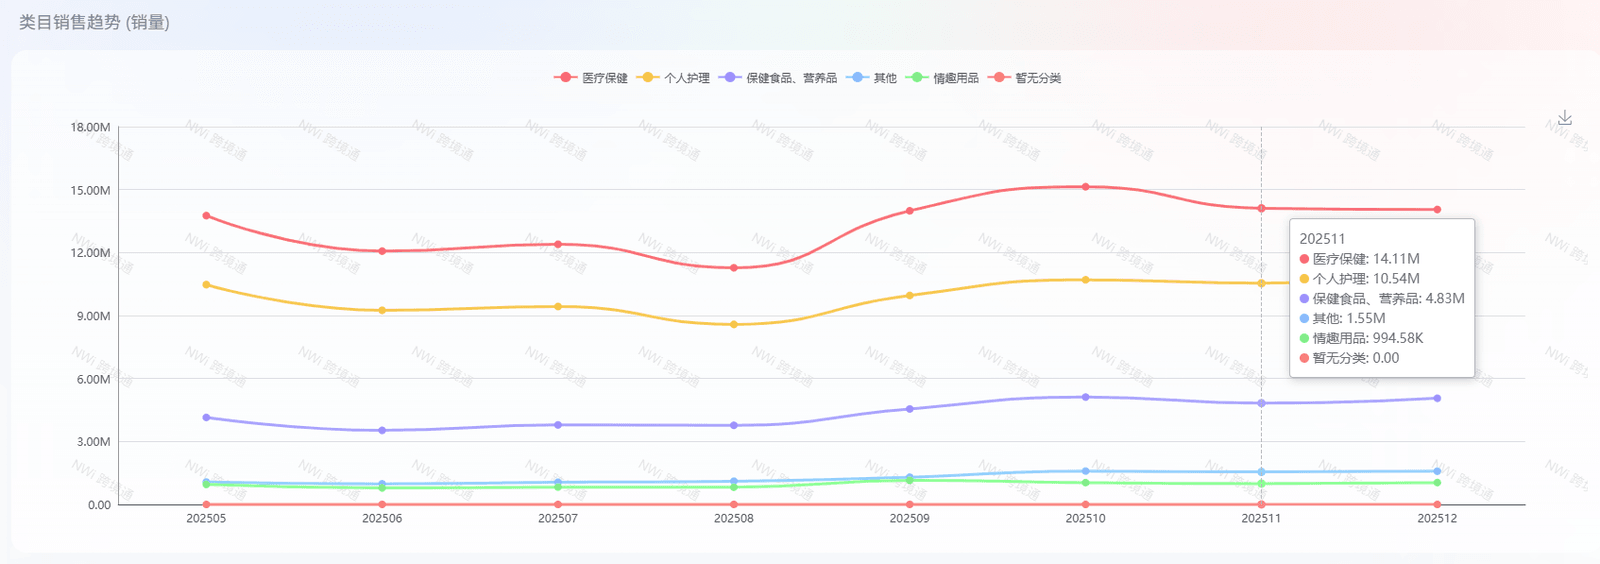
Combine total trend with share structure to improve market cycle judgment.
Identify leader structure and change paths
Review sales scale, YoY speed, concentration, and timeline in one view to spot stability, acceleration quality, and catch-up windows.
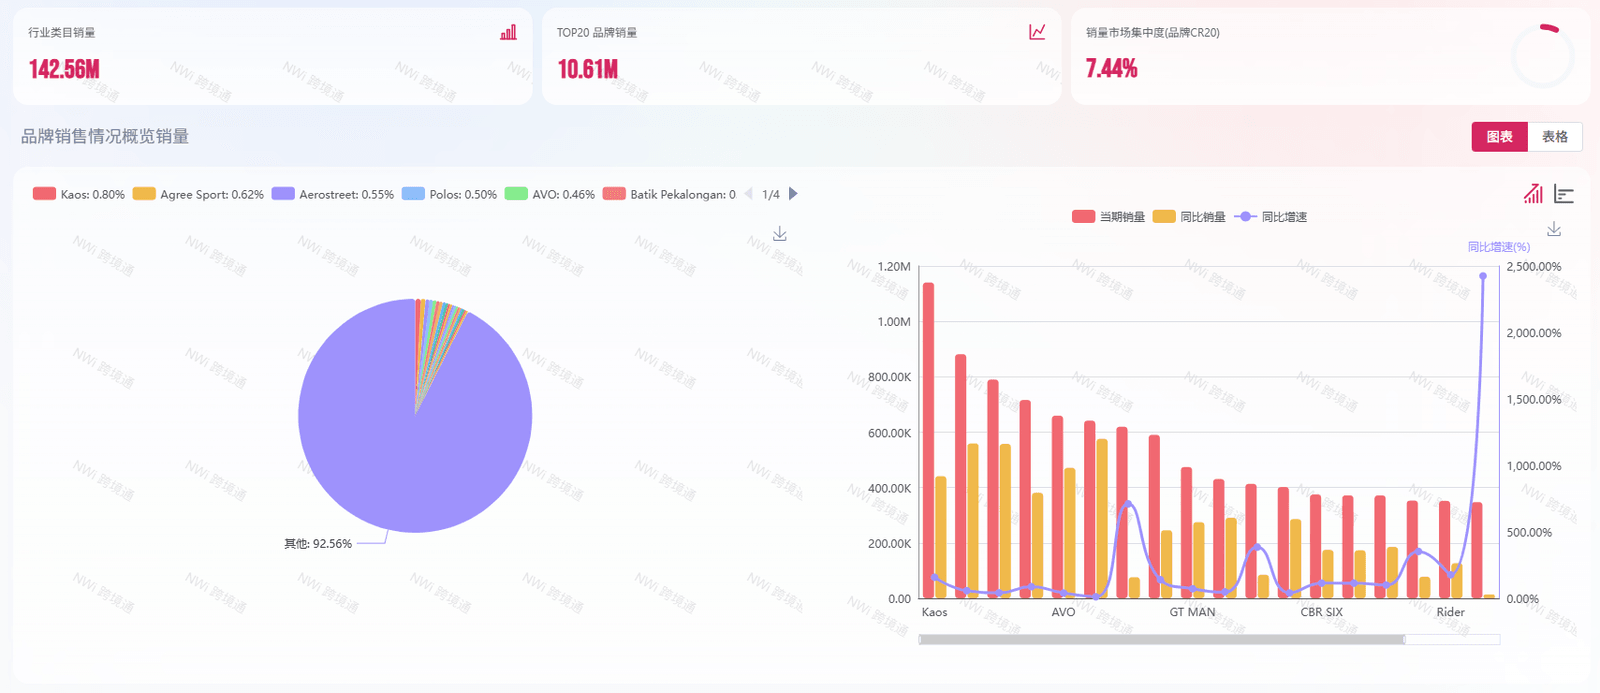
Aggregate brand sales, GMV, and YoY changes to identify leading tiers.
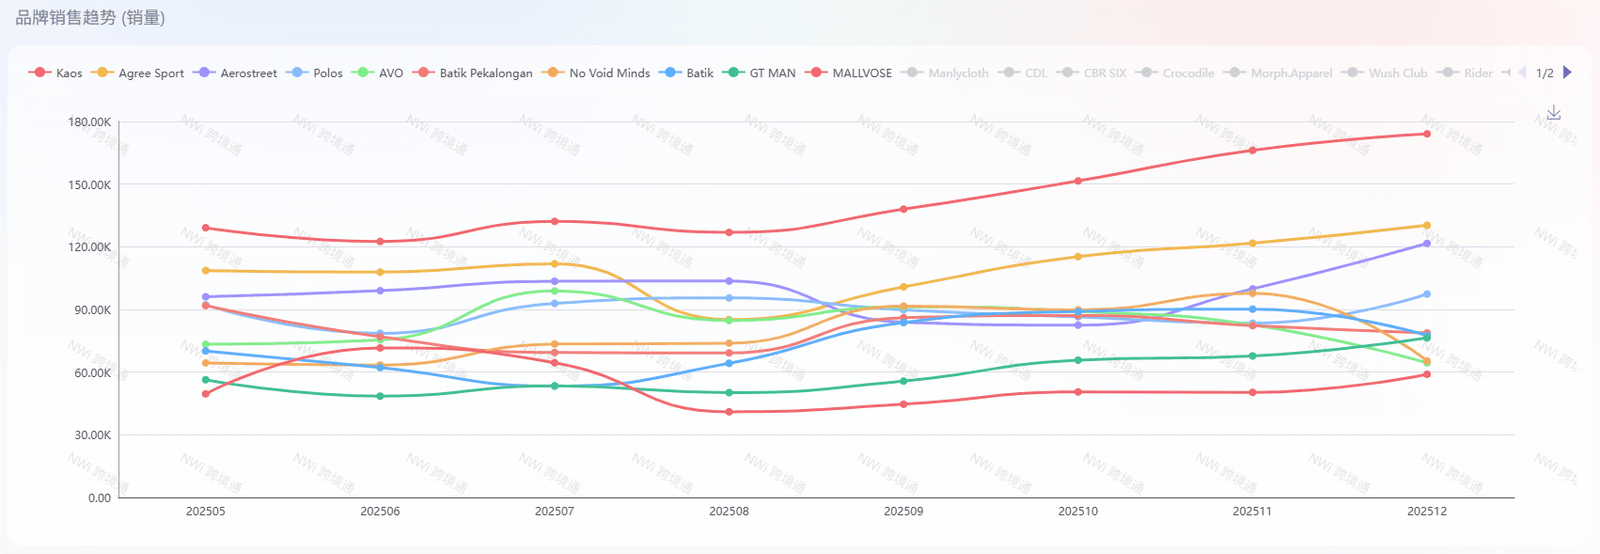
Track ranking shifts over time and evaluate growth durability.
Track store performance and operation quality
Take stores as the unit to evaluate sales, GMV, ASP and trend volatility. Identify high-quality operators for benchmarking.
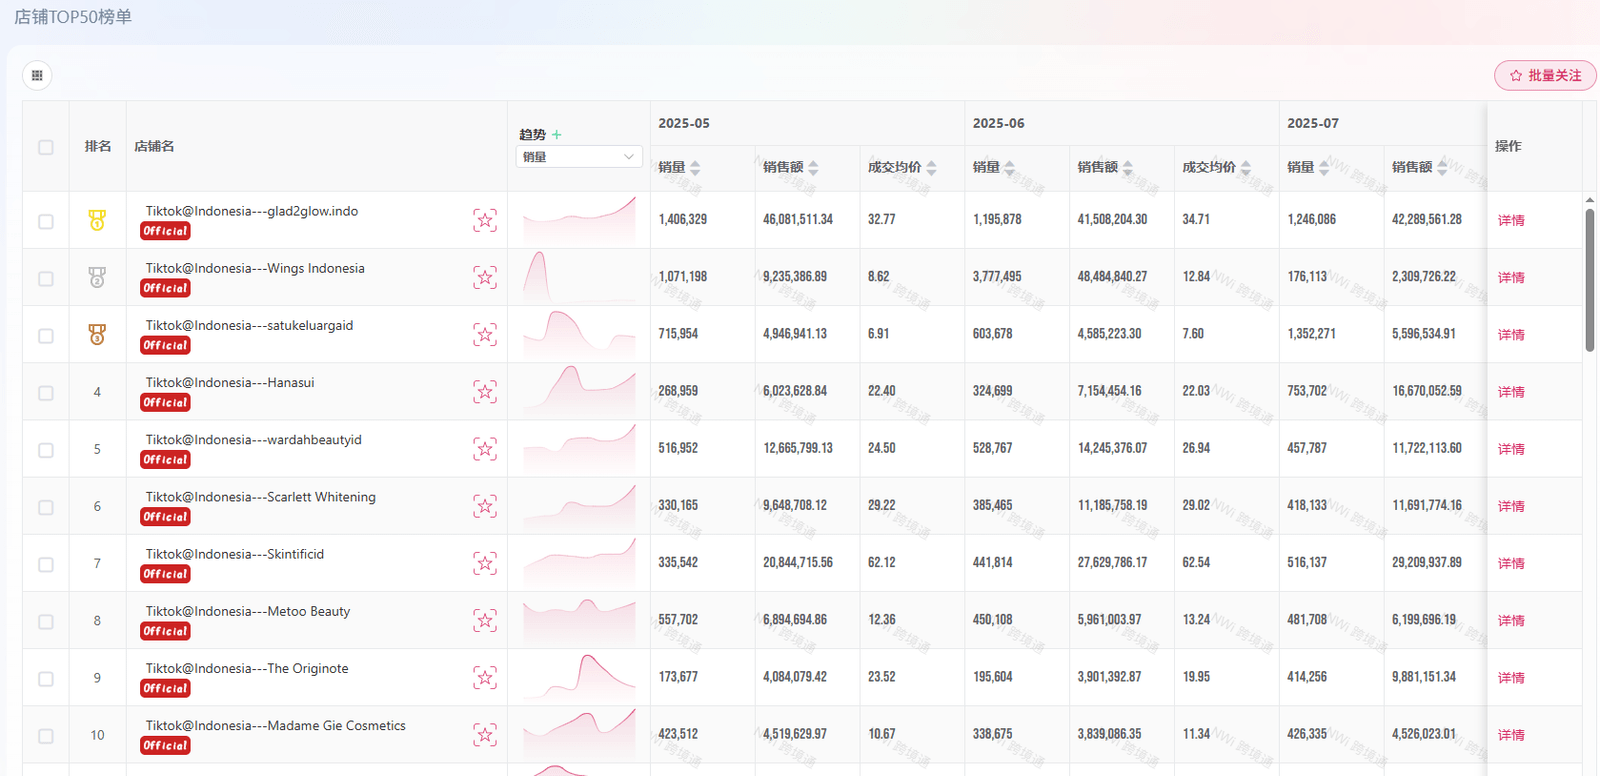
Reveal stores with stronger operational efficiency and sustained growth.
Find the real drivers behind category growth
Focus on product-layer velocity to identify key SKUs and price bands that actually move market growth and assortment optimization.
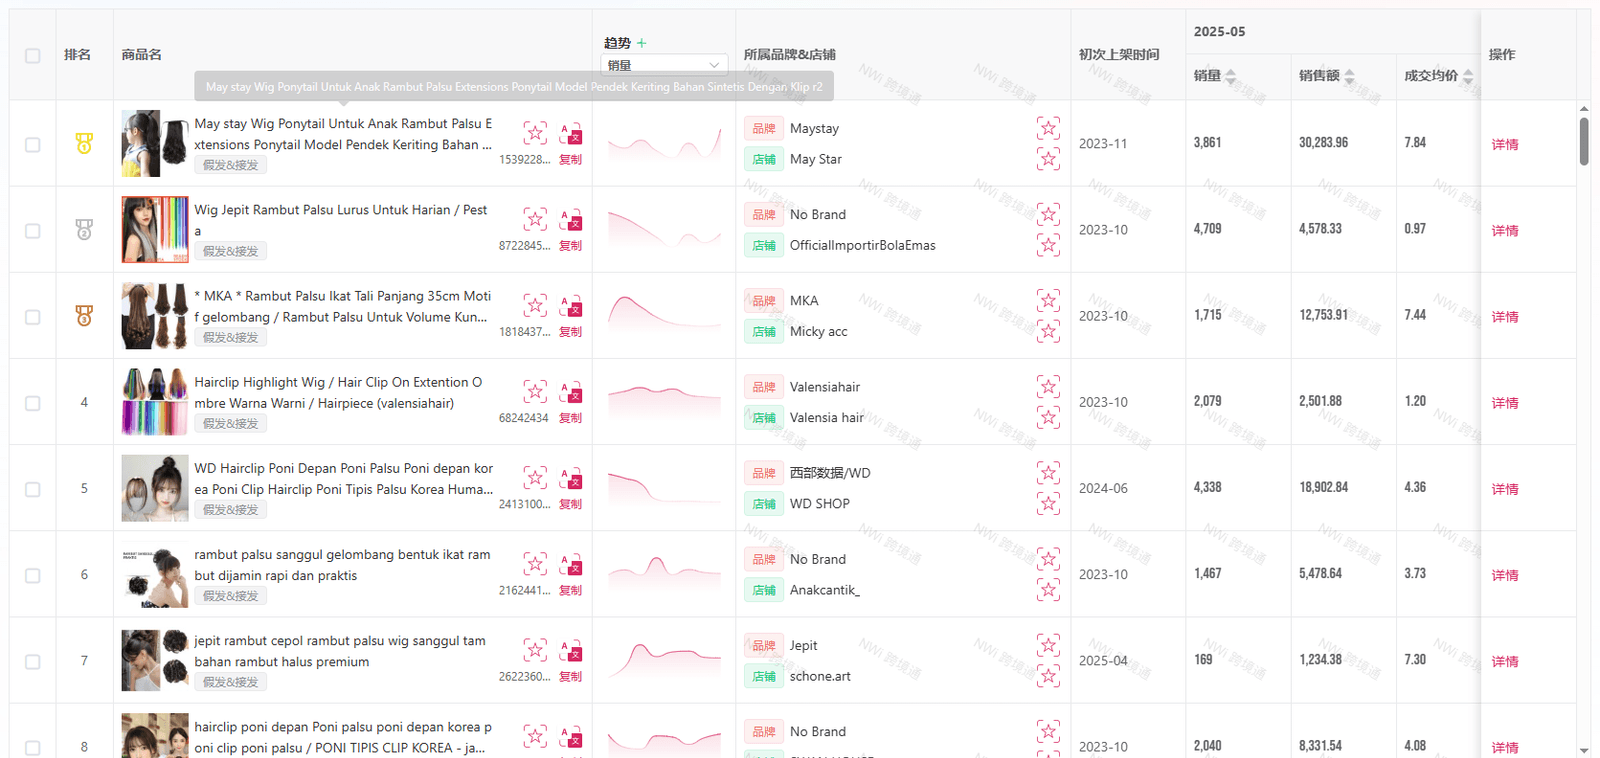
Break down product-level sales structure and locate growth-driving SKUs.
Understand share distribution and structural migration
Decompose subcategories and evaluate competitive status with both share and growth, then prioritize the most promising tracks.

Spot high-potential subcategories by share and concentration split.
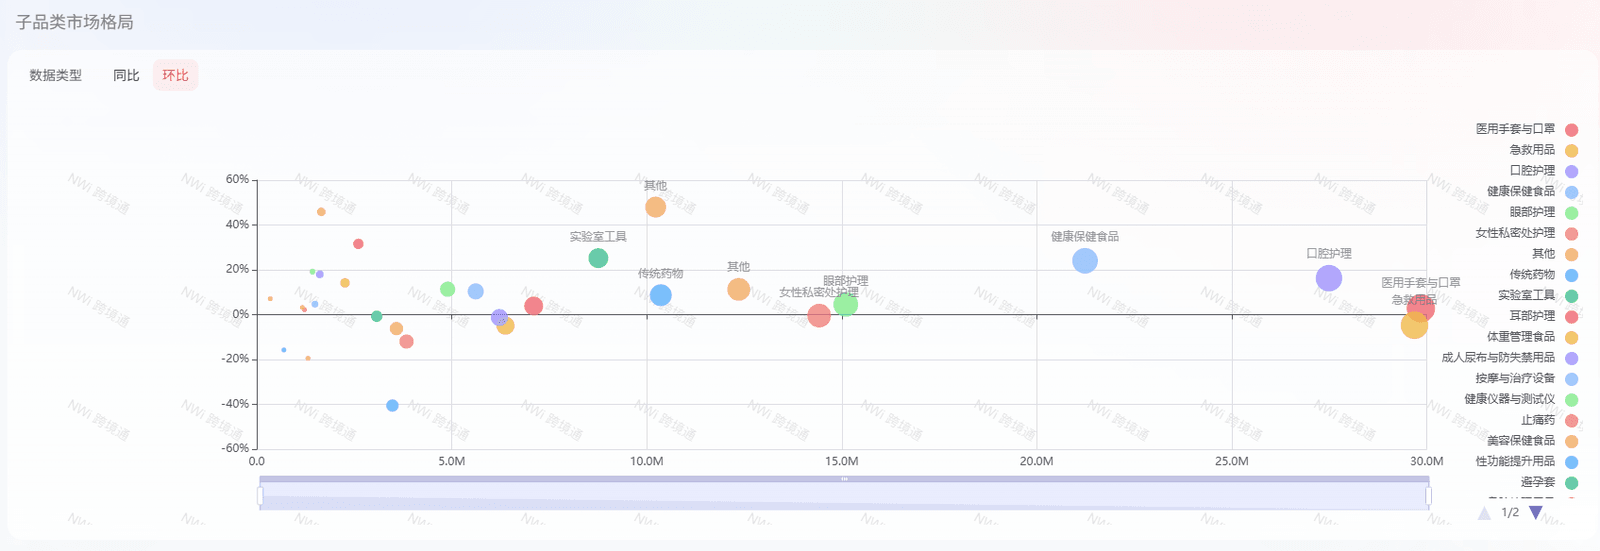
Read structural movement over time and detect turning points early.
Build a business-fit market with multi-condition filters
Assemble specific markets by platform, site, brand/store type, keywords, and price range to match real operating scenarios.
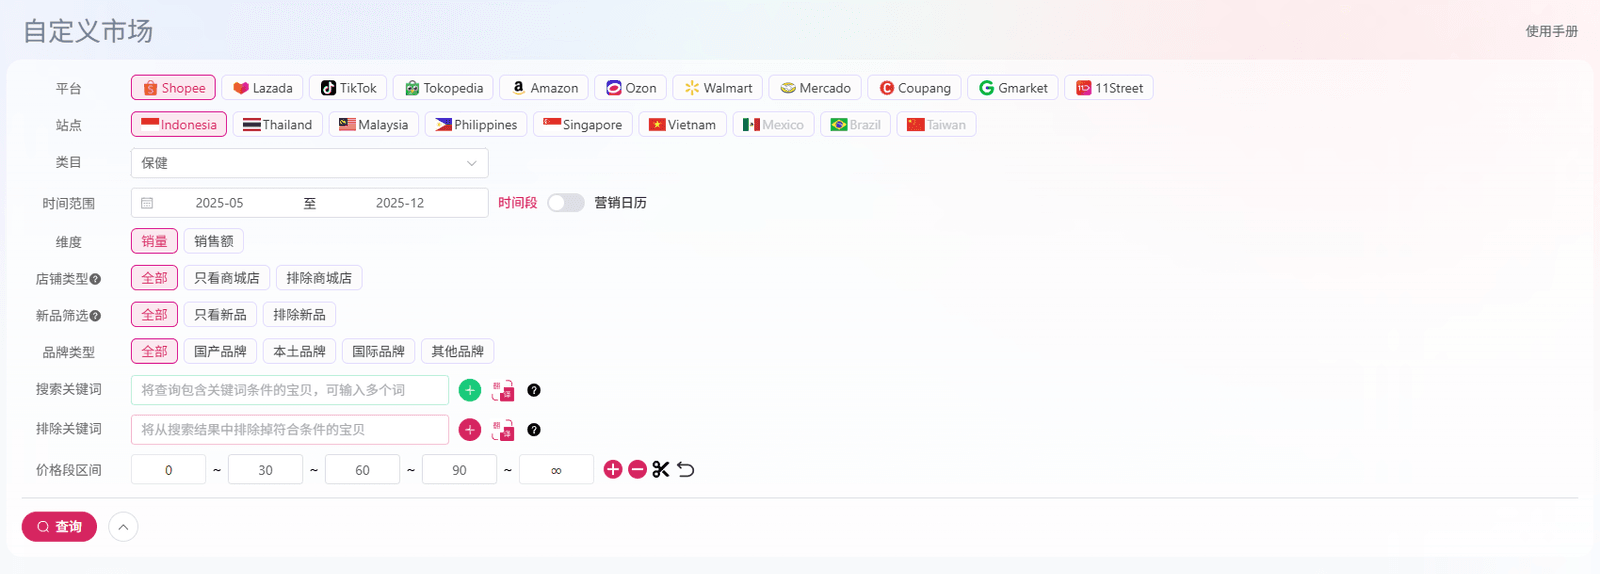
Combine platform, site, keywords, and more to build target markets.
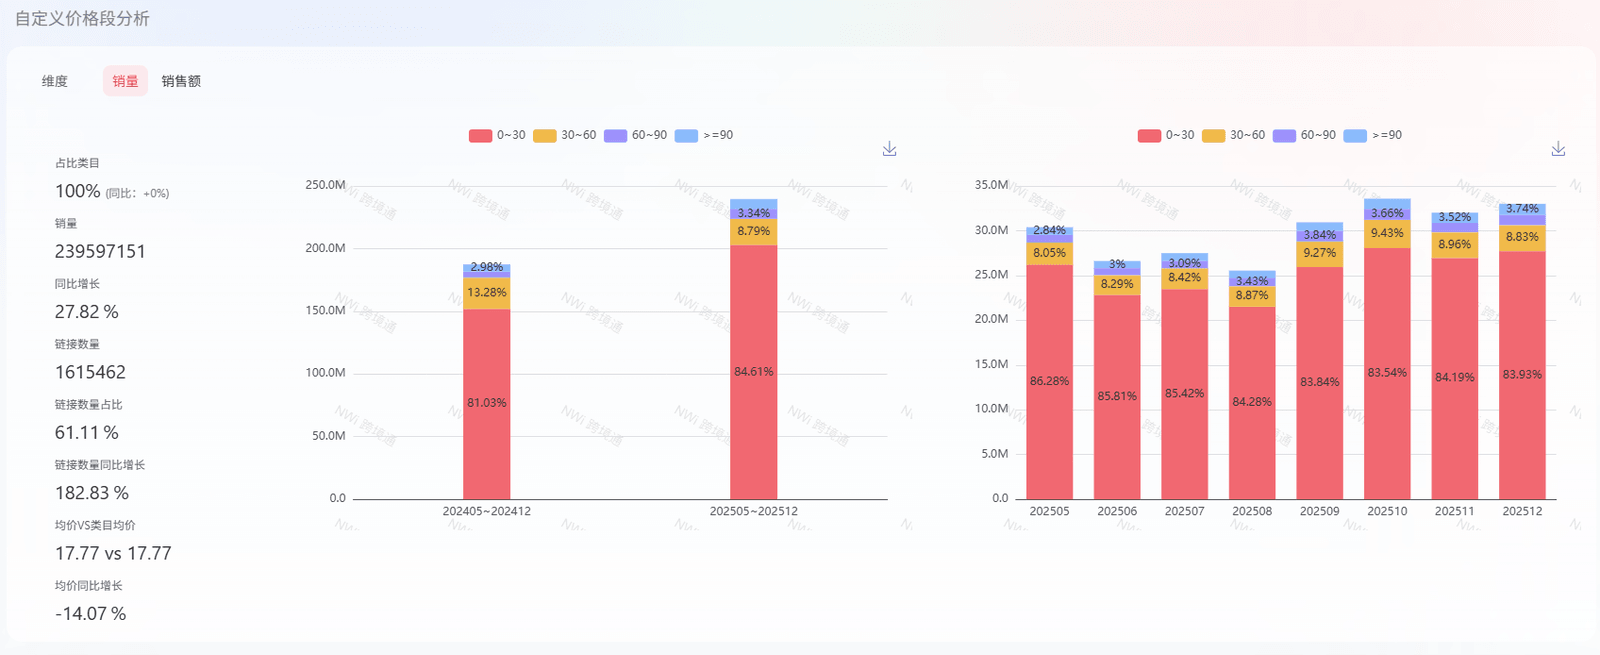
Persist outputs into reusable market pools for repeat analysis.
Find category opportunities from attributes
Use attribute cross-analysis and overview metrics to identify high-impact feature combinations for product, content, and media strategy.
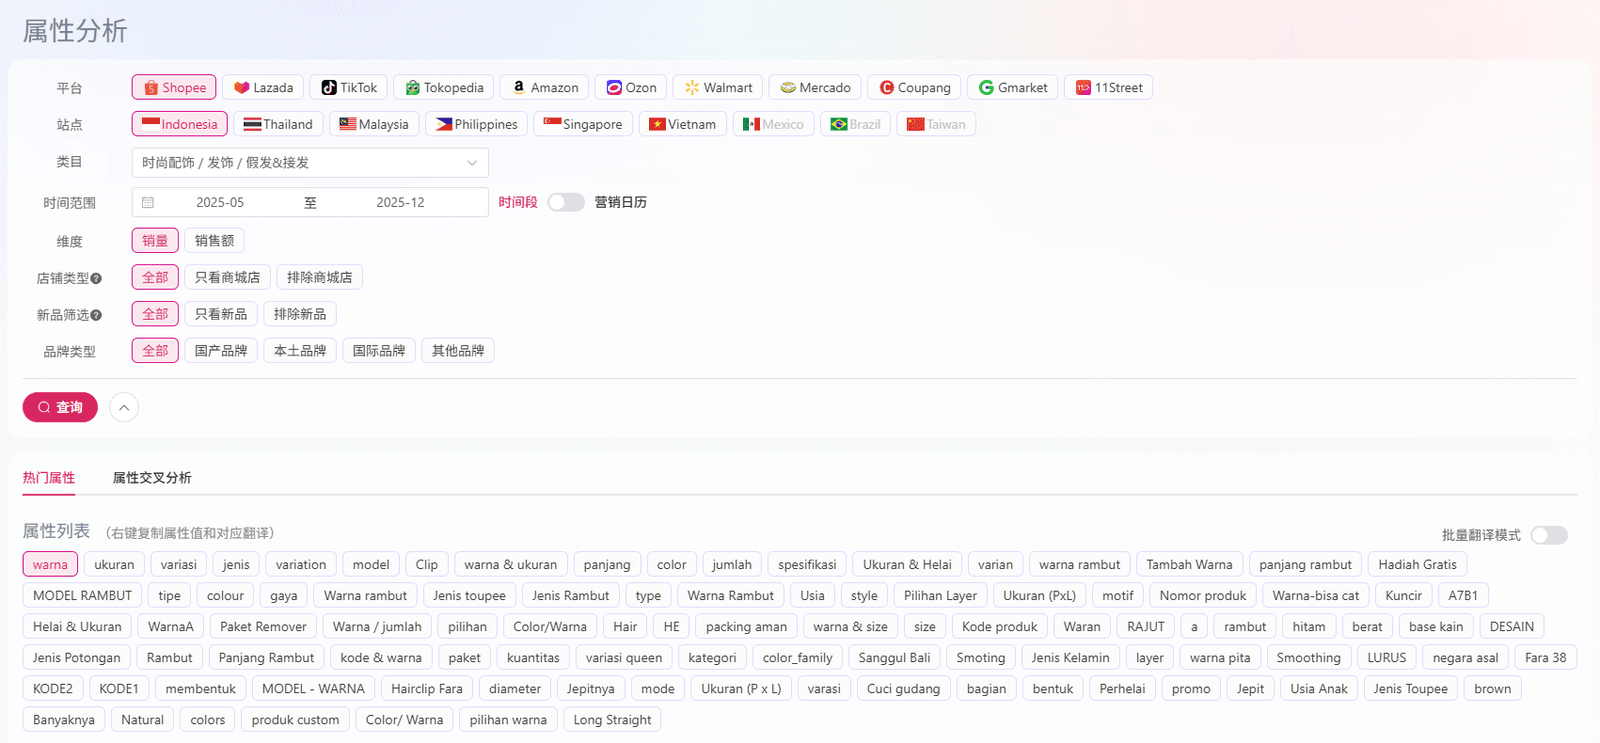
Detect which attribute terms most influence performance outcomes.
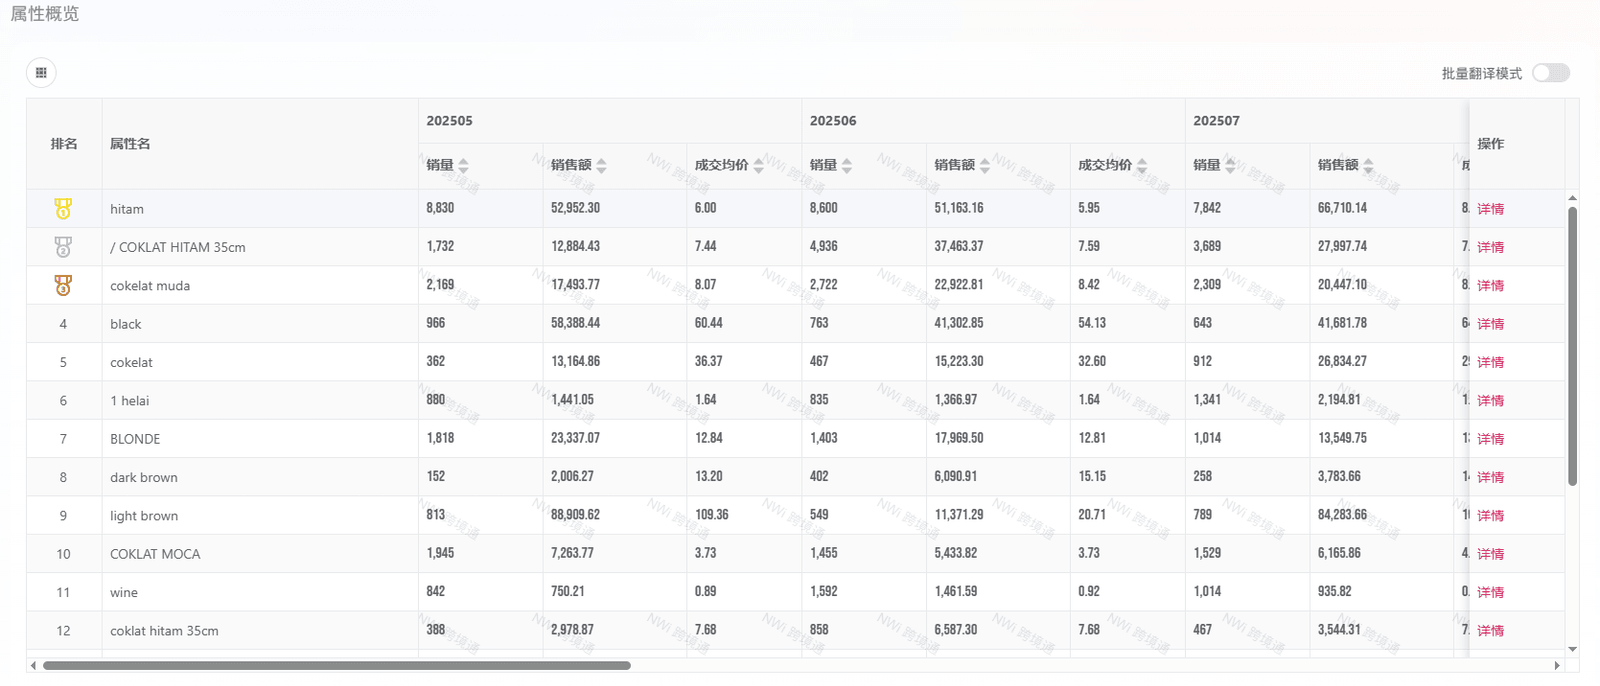
Locate feature combinations with stronger commercialization potential.
Launch global data decisions faster
Apply these global views to a real business scenario. Start a trial and experience the full data chain.
E-commerce data, methods and reports
Explore NWi EC Data product pages, platform coverage, data definitions and published research. Each source states its scope, definitions and limits.